



Editor’s Note: this post was excerpted from Diane’s handout from CreativePro Week 2018. This year, Diane will be speaking about Engaging Interactive Documents and Publish Online. There’s still time to register, or sign up for a Virtual Pass so you don’t miss out!
Any chart or graph that you use in your InDesign documents can be easily animated. You can make pie chart sections fade in or move in or out of the pie. Bar charts and line graphs can appear to grow or draw themselves. In any case, each section of the chart or graph must be a separate object.
Animating Bar Charts
Bar charts are easy to animate using a scaling trick. Select a bar, then use the Animation panel to set it to scale horizontally (in the example below) or vertically, from 0% to 100%, with the animation set to To Current Appearance.
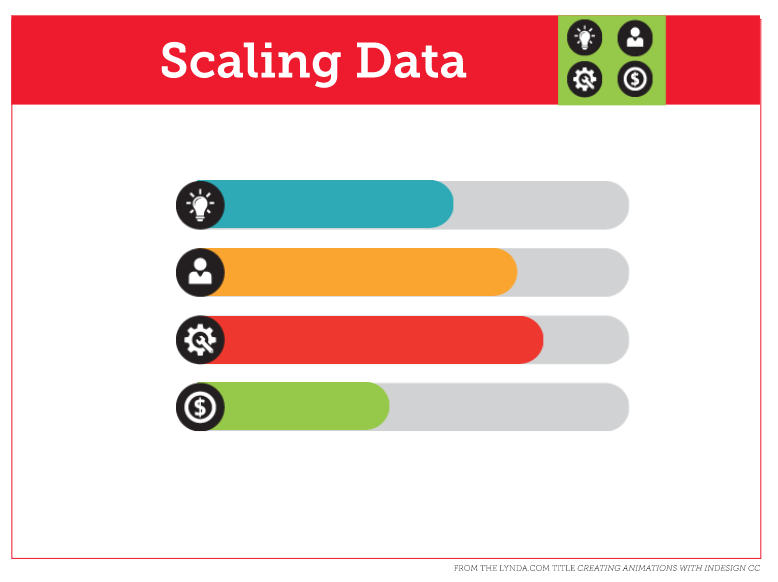
The bars can be set to scale on page load, and play one after the other or set to play all at once. Alternatively, they can be set to play when triggered by a button.
For full step-by-step instructions and a live example of an animated bar chart, click here.
This article was last modified on June 30, 2020
This article was first published on June 4, 2019
Commenting is easier and faster when you're logged in!

Recommended for you

MacBook Pro Touch Bar: Where are my function keys?
Two solutions to solve the problem of the missing function keys on newer MacBook...
Poll Results: Do non-designers edit your InDesign documents?
The results of our poll asking if you still use Flash (SWF) and a new poll on wh...
InDesign How-to Video: Create Documents With Bleed
In this week’s InDesignSecrets video, Mike Rankin sets up a document to bleed—or...