


The COVID-19 Pandemic is something that has touched us all in one way or another and as I write this, there’s no end in sight. During this challenging time, I find myself reading news articles every morning trying to decipher the do’s and don’ts of day-to-day activity as it seemed to change by the hour. I’d also find myself looking at the numbers of people infected in my state and comparing those numbers to other states including the states around me. Unfortunately, I couldn’t find any website where I could easily do this. So one night as I lie in bed, I tried to come up with a way to see the numbers in my state, and easily compare those the numbers in other states using the software tools that I use every day.
As a heavy InDesign user, I knew I could accomplish the task using multi-state objects and Publish Online. After all, I create projects like this all the time. The challenge however was how I was going to update the data to reflect the current numbers. Ideally, I’d like these numbers to update dynamically using a live data feed but that was not easily possible with InDesign. At least, not for me, since I’m not a programmer/scripter. However, I do know how to import XML data to update content in an InDesign file. What I didn’t know was whether I could combine multi-state objects with XML data import to dynamically update the numbers in a quick and painless way. It turns out that you can! Check out what the final project looks like here.
Laying Out the Document
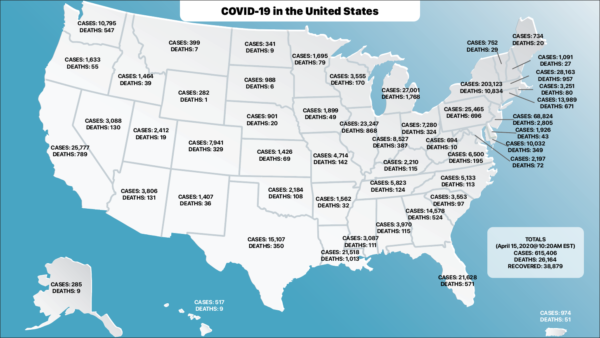
I started with a basic design which was simply a map of the United States that I downloaded from Adobe Stock. From there I added a title and an area to show the total statistics that I wanted to update daily. Next, I created a text frame over one of the states, entered the name of the state, and aligned and formatted it the way I wanted it to appear. I started with Pennsylvania since it’s my home state.
The behavior that I wanted was for the user to click on each state and have the COVID-19 statistics display for that state. This requires the use of a multi-state object (MSO) with different appearances of each state. They’re great for what I was trying to accomplish with this project. I selected the text frame and in the Object States panel, clicked on the Create New State button. This step kills two birds with one stone by creating the MSO and adding a state to the MSO as well. The MSO now has two states that look exactly the same, so for clarity I clicked on each state and named one “State” and the other “Stats”.

Creating a new state in the Object States panel.
What you need to remember with MSOs is that each state has its own set of objects. So they can have different appearances as well as different behaviors. I clicked on the Stats state, then double-clicked within the state to select the text frame within. I then entered dummy stats as a placeholder for the real content that would appear there.
Tagging the content as XML
Since I wanted to update this document on a daily basis, a manual process would be unworkable. Instead, I leveraged the power of InDesign’s XML handling features. I started by opening up the Tags pane in InDesign by choosing Window > Utilities > Tags. XML tags are used to identify content in an XML file and also within InDesign. I created a tag for each piece of data that I wanted to update. In my case this included Content, State, Stats, and Totals.
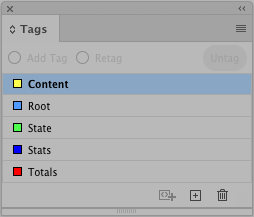
Tags added to the Tags panel in InDesign.
I don’t want to dive too deep into XML structure here, but I wanted the XML structure to be logical. So I selected the frame in each state and tagged the frame itself using the Stats and State tags respectively.
Then the text within those frames I tagged using the Content tag. Again, this just created nice logical XML structure. There’s a trick to this process, by the way. If you tag all of the text content within a frame, it’ll retag the entire frame using that tag. So to tag my content correctly, I added a space after the content and select only the content before the space. I did the same thing in the Stats state with the paragraph returns. The returns aren’t tagged. You can remove that sacrificial space once you’re done tagging if you’d like. When you’re finished, your frame should look like the figure below. Note that you will want to choose View > Structure > Show Tag Markers and View > Structure > Show Tagged Frames to see how your content is tagged. At this point, you can also choose View > Structure > Show Structure to display the Structure pane in InDesign. This shows you all of the tagged XML content in the document.
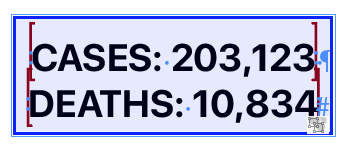
The tagged content in InDesign with Tagged Frames and Tag Markers displayed.
We’re now going to use this MSO as a prototype for the other states on the map. Using the Selection tool either Alt/Option-drag or copy/paste the MSO to the next state that you want to create. Simply go into the State state (sorry for the confusion) and edit the text of that state to reflect the U.S. state that is being represented. Repeat this process about 49 more times until you have all of the states represented. What’s nice about this step, even though it’s a bit mundane, is that as you duplicate the MSO, the XML tagging comes along for the ride. So when you’re finished, the Structure pane should contain a long list of State and Stats objects that represent the XML content of each state in the InDesign document.
Creating the XML Data Source
The nice thing about tagging your InDesign document first, is that it allows you to export to an XML file and all of the data from the InDesign document will be represented. Choose File > Export and in the format drop-down menu choose XML, then choose Save. Open the XML file in the application of your choice. You can use a basic text editor if you’d like, but a dedicated XML editor makes things a bit easier because it will display your XML structure in a clear fashion. I like to use the Oxygen XML Editor because there’s a version for both Mac and Windows however there are a ton of XML editors out there.

The XML data source.
With the file open you’ll notice that the content from the InDesign file is represented using the appropriate XML tags. This file now becomes your data source for your new information. Each morning when I want to update the information I edit this file with the new information that was released. Now I know there are going to be plenty of people reading this asking why on earth I would want to do this manually. To be honest, I don’t. However, I couldn’t find a reliable XML data source that I could use to obtain an automatically generated XML file, which would have been ideal. My focus for this project was to see if what I wanted to do was possible and to avoid having to manually update the InDesign file, which would have taken quite a bit longer. What I found during this process though was that it took me about 10 minutes of my time each morning to update the data, which is considerably faster than updating it manually in the InDesign document. The side benefit of updating the data manually was that it connected me with the numbers. As I make the updates I can see how significant the changes are as well as when those numbers start to level out, which is the ultimate goal for all of us. For future projects, I’ll definitely be looking for a reliable data source to use in order to save more time. The process would have been slightly different if I was starting with an existing XML file but the process would be relatively the same.
Importing the XML Data
With the data updated, it’s time to bring that data into the InDesign document. In InDesign, choose File > Import XML. Navigate to the XML file that you saved earlier. In the Import XML dialog box, make sure that Show XML Import Options is chosen. In the XML Import Options, enable Clone Repeating Text Elements, Only Import Elements That Match Existing Structure, and Do Not Import Contents of Whitespace-only Elements. Click OK. The new data should import into the InDesign document updating the XML content in the process. To be fair, tagging the state name was only to make it easier to update the data. The state doesn’t technically need to be imported each time, but it makes it easier to see which data is connected to each state in the XML file. If you’d like to see the process in action, watch this video.
Publishing the Final Project
The options for making this project available to other users was somewhat limited. This was due to the use of the multi-state objects. MSOs only render in certain formats including Fixed-Layout EPUB, Publish Online, and In5. Other formats such as PDF can’t display MSOs. For this project I chose Publish Online due to the ease of doing so and because I can distribute the project easily by simply sharing the URL with other users, and on social media. You can see this final project in action which is still being updated each morning.
Summary
This project started with an idea of how users could quickly compare COVID-19 data for each US state and ended with a finalized project allowing users to do exactly that. By leveraging the ability of InDesign to work with XML data as well as the Publish Online feature, I was able to create an interactive project that I could easily update at a moment’s notice.
This article was last modified on October 14, 2020
This article was first published on April 19, 2020
Commenting is easier and faster when you're logged in!

Recommended for you

The Case for QR Codes
Sandee Cohen looks at the many uses for QR Codes, as well as how to create and e...

*Click* *Click*… for Victory!
An insightful look into what's actually happening when you double-click with the...

Spaced out dots…
I love my dots, but want more from InDesign when it comes to dots. Let's space o...