
Taking InDesign Tables Up a Notch
Learn how to use tables in ways that break out of the same old spreadsheet mold.

This article appears in Issue 78 of InDesign Magazine.
Rows and columns. Columns and rows. Frankly, InDesign’s table feature is not something that excites everyone. Some simply find tables boring, while for others the process of creating tables is confusing and frustrating.
I’m a big fan of InDesign tables. I use them all the time, most often for elements in my layout that look like a table—like an Excel spreadsheet (only prettier, of course). But other times, I use them in ways that break out of that mold, and I use them in layouts that don’t obviously look like tables.
If you think about it, tables have some interesting and unique characteristics: cells can be merged, strokes can be completely reworked or turned off altogether, cells can be a fixed height or change height based on what’s in them. And underneath it all is this beautiful grid. Throw in graphics cell, which you can use to create all kinds of interesting possibilities by itself, and tables can take on a whole new meaning.
Reviewing the Basics
If you haven’t worked much with InDesign tables, there are a few basic things you need to know. Tables work a little differently than other InDesign objects.
First, all tables live inside a text frame. No table stands on its own. The text frame can be smaller or larger, or it may be the same size as the table so that you don’t see it. But it’s always there. Inside the text frame, the table behaves like an inline object; type text before the table, and the table will move along with the text.
Second, to select a table or its cells for formatting, you must use the Type tool. You can move your cursor to the left or the top of the table and click to select a row or column. Click in the upper-left corner of a table to select the entire table. Click in a cell and drag across a group of cells to select them. Once you’ve selected the cell(s), you can then apply formatting.
- Select a single cell by clicking in the cell and pressing the Esc key.
- To format a single cell, you don’t have to select it first. Just click in a cell and use the keyboard shortcut for Cell Options: Option+Command+B/Alt+Ctrl+B. As you change the formatting, you can see changes more easily than when the cell is highlighted.
- Access the Table Options dialog box by clicking in a cell and pressing Shift+Option+Command+B/Shift+Alt+Ctrl+B. Again, you can see formatting changes more easily than if the entire table is highlighted.
- Select the entire table by clicking in a single cell, and pressing Option+Command/Alt+Ctrl+A.
Creating Tables
There are three basic ways to create a new table.
First, you can create a table from scratch. If you want the table to be in the flow of your text, simply position your cursor on a new line, and choose Table > Insert Table. A dialog box lets you define the rows or columns you want your table to have, and it allows you to apply the built-in Basic Table style or any other table style you’ve created.
If you want a table that stands on its own and isn’t part of an existing text thread, you can choose Table > Create Table. The same dialog box lets you specify your basic table setup.
The overall size of the table depends on what you do next. If you click, the table will fill the entire area between margins on your page, and it will divide the rows and columns evenly. If you click and drag, the table will be the size of the area you draw. In either case, the containing text frame will be the same size as the table.
Another way to create a table is to convert tabbed (or other delimited) text in your document to a table. Select it, then choose Table > Convert Text to Table. A dialog box lets you set the character that will divide rows and columns—usually a tab character but also a comma or a paragraph return—to divide columns and rows. Your text becomes a table.
The third, and perhaps most common, way to create a table is to import an Excel file or a Word document that includes a table. When placing these files, it’s a good idea to use the Import Options dialog box. Select the option in the Place dialog box, or press the Shift key while you click Open.
The import options let you choose whether to bring in the formatting from the Excel or Word file. Excel import options (Figure 1) also let you control which part of the spreadsheet you bring in. You don’t have to import all the data created by the company bean counters!
![Excel import options dialog box. Options section: Sheet: Fall; View: [Ignore View]; Cell Range: A1:12; Import Hidden Cells Not Saved in View not checked; Formatting section — Table: Unformatted Table; Table Style: [Basic Table]; Cell Alignment: Current Spreadsheet; Include Inline Graphics checked; Number of Decimal Places to Include: 3; Use Typographer's Quotes, checked.](https://creativepro.com/wp-content/uploads/2024/12/taking_tables_up_notch-fig01.jpg)
Figure 1: Excel import options allow you to specify which part of the spreadsheet will be imported, and whether or not to maintain any formatting applied in Excel.
Table Mechanics 101
Once you’ve created your table, you need to master some basic mechanics, such as navigating around a table and moving, inserting, or deleting rows and columns.
When selecting a cell, you can select just the content of the cell, or the entire cell.
Click inside a cell and use Command+A/Ctrl+A to select the text only, or press Esc to select the entire cell along with the text inside it. To select a graphic cell, click on the graphic frame with the Selection tool. Switch to the Type tool, and drag to select the containing cell.
To move from cell to cell, you can use the arrow keys. You can also use the Tab key to move to the next cell to the right, or Shift+Tab to move to the left.
Moving rows or columns is easy with drag and drop. With the Type tool, select a row or column, and then position your cursor over the selection. A special drag-and-drop cursor (![]() ) will appear, and you can simply move the selection to another location in the table, as indicated by a dark blue line.
) will appear, and you can simply move the selection to another location in the table, as indicated by a dark blue line.
To insert a new row or column, click on an adjacent row or column and choose Table > Insert. A dialog box lets you set how many new rows or columns you want and if you want them to the left or right of the insertion point. You can also insert rows or columns by duplicating them using drag and drop. (See sidebar, “Duplicating Rows or Columns.”)
To delete a row or column, select it, and then choose Table > Delete. If you just press the Delete key, only the text inside the cells will be deleted. Or use keyboard shortcuts, Command+Delete/Ctrl+Delete for rows, or Shift+Delete for columns.
Once you’ve mastered the mechanics of working with tables, it’s time to have fun with formatting.
- To duplicate a row that has content in it, whether text or graphics, use drag and drop. Select the row or column, and then mouse over to get the drag-and-drop icon. Hold down the Option/Alt key, and you’ll see a little + sign next to the cursor. Drag to a new position, and your row or column will be duplicated, including its content.
- To duplicate/insert a row or column without its content, position your cursor over the bottom or right edge of the cell until you see a two-headed arrow. You can drag the cell’s edge to increase the height or width. But if you mouse down, and then press the Option/Alt key and drag, you’ll duplicate the row or column, including its format, but not its content.
Accessing Table Commands
There are several ways to access table commands, and you can choose whichever method suits your work style best. There is, of course, an entire Table menu that contains all the options for working with tables, including three that you can find only there: Create/Insert New Table, Convert Text to Table, and Convert Table to Text.
All other table commands are available in a contextual menu. In order to get contextual menu that applies to the table and not the one for text, you must select at least a cell, not just its content. Once a cell is selected, right-click to display the menu. This is probably the technique I use most frequently (Figure 2).
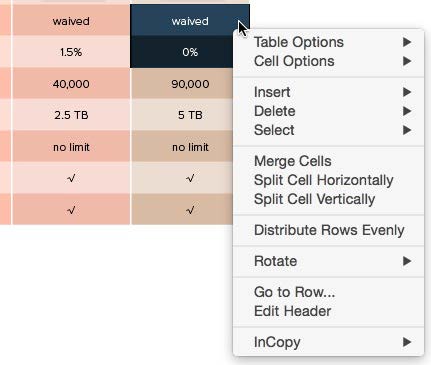
Figure 2: Select one or more cells, and then right-click to quickly access table commands using the contextual menu.
When you select a cell or part of a table, the Control panel changes to display most of the cell formatting settings you’ll need, such as text insets, vertical alignment, and row height and column width, as well as strokes and fills. When it comes to strokes and fills, you can also change settings using the Swatches panel and the Stroke panel.
If you like panels, there is a Table panel. You’ll find it at Window > Type & Tables.
And finally, several keyboard shortcuts are useful for bringing up the Table and Cell Options dialog boxes. (See sidebar, “Single Cell Power.”)
Table vs. Cell Formatting
If you haven’t done a lot of work with tables, be sure you understand the difference between table-level formatting and cell-level formatting.
Understanding this difference will help you format your tables more efficiently and is essential to successfully setting up Table and Cell styles. If you look at the Table menu, table and cell formatting is clearly divided into two separate commands.
Table-level formatting is, of course, formatting that effects the entire table. But not that much formatting actually applies to an entire table. The number of rows and columns is often determined by the information in your table (or they are imported from another source). Just about the only table formatting you’ll do regularly is to set a border stroke or apply alternating fills or strokes to the entire table. That’s it.
Most of the formatting action is done at the cell level, whether applied to a single cell, several cells, or all the cells in a table at once. Cell formatting includes settings similar to text frame options, such as insets, vertical alignment, and first baseline position (Figure 3).
Cell options also let you set stroke and fill patterns for individual cells or groups of cells, and allow you to adjust the height of rows or the width of columns.
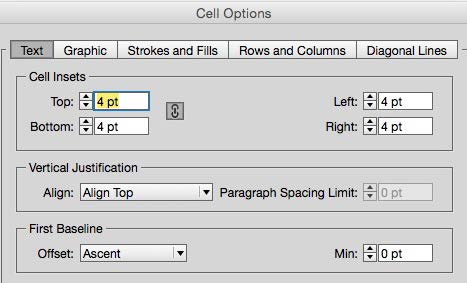
Figure 3: Cell options for text include settings similar to those for regular text frames, found in the Text Frame Options dialog box.
Training Strokes to Behave
One of the most effective things you can do to improve the appearance of your tables is to change the pattern of row and column strokes. The default, 1-pt black stroke around all cells just screams, “Boring!”
The problem is, working with table strokes is not very intuitive. I remember well the trouble I had understanding them when I first started learning about tables.
The key to working with strokes is the stroke proxy. You click to select the strokes of the proxy that represent the table strokes you want to format, and click off the strokes you don’t want to format.
The proxy will change its appearance, too, depending on how many cells you have selected. If you select just one cell, there are only four strokes on the proxy, each stroke in the proxy representing a stroke on one of the four sides of the cell.
But when you have several cells selected, or an entire table, the proxy has six strokes: four on the outside and two on the inside.
Each outside stroke on the proxy, again, represents the individual outside strokes of the cells selected (or the border, if the whole table is selected).
But the inside horizontal and vertical strokes of the proxy each represent all the inside horizontal or vertical strokes in the cells you’ve selected. One of these proxy strokes can represent many strokes in your table.
Sounds simple enough, but it can easily get confusing to turn on and off the strokes you intend to. To avoid confusion, when you’re going to change the overall stroke pattern of your table, try this: start by turning all the strokes off, and then build the pattern. To turn off any stroke, select it in the proxy and set the color to [None]. This also sets the weight of the stroke to 0 (zero). By starting with no strokes, it’s easy to figure out which strokes you want to format.
In fact, turning off all the strokes on a table gives you the flexibility to use tables in all kinds of new ways. It’s the first step to freeing your tables from that spreadsheet look, allowing you to use the underlying grid of a table to work for you in other types of layouts that don’t even look like tables at all. In the sidebar “Resizing Graphics,” you can see an example of how using a table in this manner provided the perfect solution to our layout challenge.
It’s good to mix up stroke patterns in your table. But turning on and off parts of the stroke proxy can be tedious.
Use these clicking shortcuts instead of clicking strokes one by one.


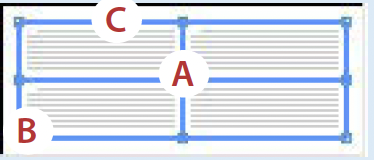
- A. Click once at the intersection of the inside strokes to turn the inside strokes on/off.B. Click once on any corner point to turn the two adjoining strokes on/off.
C. Click twice on any outside stroke to turn off/on all outside strokes.
Triple-click on any stroke or point to turn all strokes on/off.
You can use alternating row and column strokes to set stroke patterns for your entire table. In the Alternating Row/Column Strokes tabs of the Table Options dialog box, set the Alternating Pattern to Every Other Row/Column. Set the weight, stroke, and color of the First stroke to be the same as the Next stroke.
This technique allows you to create stroke patterns that don’t require cell formatting or cell styles.
To create a table that by default has no strokes, set Row and Column strokes Color to [None], and set the Border stroke color to [None].
You can easily capture these settings in a table style and use it throughout your document. Or make it the default style by clicking on the style name when no table is selected.
Make Friends with Styles
If you create a table only occasionally, you may never need table or cell styles. But they can be helpful in a number of ways.
Table and cell styles can help you:
- Apply cell formatting to any table more quickly.
- Speed up the process of applying the same table design across several different tables and help ensure formatting consistency.
- Maintain formatting when updating a linked Excel or Word table.
- Create cleaner code when exporting to reflowable ePub files.
Table and cell styles can be a little tricky at first, though, because while they work similarly to text or object styles in some ways, they work quite differently in others. And it doesn’t help that some of the formatting we can apply via Table and Cell options cannot be captured as part of the style. More on that in a moment.
Both table and cell styles can be defined like other styles: by either opening the style option dialog box and specifying various format settings, or by selecting a cell or table that’s already formatted and creating a new style based on that format.
Table and cell styles can be loaded into other documents, too, like other styles. Choose Load Styles from either the Table or Cell Styles panel menus, and point to the document that contains the styles you want to bring into your current file.
Cell styles are important to use because they can help you format tables more quickly, even if you don’t use them as part of a table style. Cell styles allow you to define all the attributes found in the Cell Options dialog box, with the exception of row height and column width. Row height and column width have to be set manually, separately from the style. This can be a little confusing at first, but it’s best to just accept it and move on, because cell styles can otherwise be immensely useful.
Cell styles do let you apply all text options such as insets and vertical alignment, as well as all fill and stroke options. And a real bonus of cell styles is that they allow you to format the text within a cell by applying a paragraph style as part of the cell style.
Table styles let you apply the attributes found in the Table Options dialog box, such as the border stroke, alternating fills, and alternating strokes. You cannot, however, specify the number of header or footer rows. You must change the rows using the Convert to Header/Footer Rows command.
Table styles’ real power is in the unique ability that lets you assign cell styles to different parts of the table. Once the appropriate cell styles are set up, they can be assigned to five regions of the table: the header row, footer row, the left column, the right column, and the center, or body, cells of the table (Figure 4).
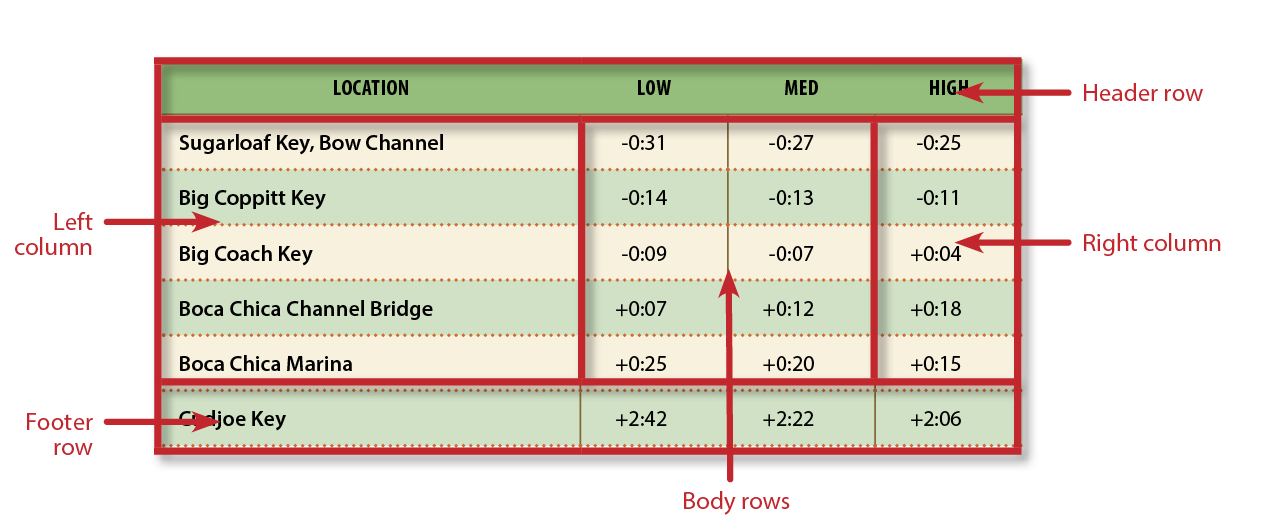
Figure 4: A table style lets you assign cell styles to any one of five “zones” in your table.
This “zonal” approach to applying cell styles means that you can often use a table style to do all the formatting for you. Table styles can take a little time to set up, and you’ll always have to set the row heights and column widths, and convert header and footer rows as necessary. But then, with one magic click, your table will be formatted.
Often, though, you’ll find that a table style can’t format every single cell. Maybe your left and right header cells don’t have the same borders as the rest of the cells in the header. Or maybe you have highlight colors on various rows in a pattern that can’t be captured in assigning alternating fills. In these kinds of cases, you may need to create what I call a “fix it” cell style. This is a cell style that takes care of styling cells that don’t strictly adhere to the “zones” formatted by the table style. Still, using a table style with “fix it” cell styles can really speed up the process of applying the same format to multiple tables.
Working with Graphic Cells
Graphic cells make it much easier to work with images in tables. They are also a object type with some interesting characteristics.
You have two ways to create a graphic cell. First, you can place a graphic directly in a cell. That’s it. Just choose the Place command and place the image—no need to select the Type tool first.
You can also create a graphic cell by selecting a cell and choosing Table > Convert Cell to Graphic Cell. A graphics frame is created in the cell.
With either technique, a graphic frame is created that has no fill or stroke applied, and has the fitting option Fill Frame Proportionally set.
One interesting thing about these graphic frames is that the edge of the graphics frame is “glued” to the cell edge. Resize one, and the other will resize, too.
While the sizing of the graphic cell is tied to the cell size, and vice versa, the graphic frame in the cell otherwise functions as any other graphics frame in InDesign. You can resize the graphic within the frame. You can apply a stroke, add points to the frame, or even change the shape of the frame using Object > Convert Shape (Figure 5). You can create and apply object styles to the frame.

Figure 5: Graphic frames within graphic cells can be modified just as other frames, including changing the frame shape or applying effects.
These kinds of changes have to be applied to each frame one by one, by first clicking the frame with the Selection tool. However, If you select multiple graphic cells using the Type tool, there are other formatting changes you can make.
When you select graphic cell(s) using the Type tool, there are three attributes you can control. First, in the Graphic tab of the Cell Options dialog box, you can set insets for the graphic frame. These insets will push the edge of the graphic frame away from the edge of the cell. The two remain connected, though, with the insets applied. Graphic insets can be part of a cell style.
In the Control panel, two other settings become available (Figure 6). You can choose different fitting options, such as Fit Content Proportionally, Center Content, or Auto Fit. You can also apply transparency effects, such as Drop Shadows or Bevel and Emboss.
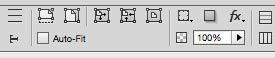
Figure 6: With graphic cells selected with the Type tool, the Control panel lets you set various fitting options and apply effects to the graphics.
These settings cannot be included as part of a cell style, but they are easy to apply to multiple cells at once by selecting the cells with the Type tool first.
The Table menu also has commands for converting a graphic cell back to a text cell. In this case, the existing graphic frame will be anchored in the text cell. You cannot convert a text cell to a graphic cell if there is text in the cell; the option will be grayed out. Only empty text cells can be converted.
If you merge two graphic cells, both graphic frames will be anchored in the cell, with a line break between. This is the same behavior as when you merge two text cells with text in them, i.e, a return or line break will be added between the two bits of text.
When you work with multiple images in graphic cells, you’ll often want to resize several images in the same row or column at once. Here’s how.
1. Use the Type tool to select all images.

2. In the Control panel, set all images to Auto Fit.
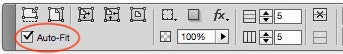
3. Go to the Graphics tab of the Cell Options dialog box, and adjust the insets, or change the insets in the Control panel. The graphic frame will get smaller, as will the images within. Cropping will be unchanged.
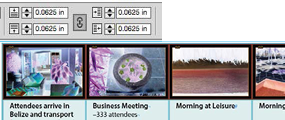

Before

After
Tricks of the Trade
Once you start working with InDesign tables and understand all the things you can do with them, you can start busting out some new moves. Here are a few ideas about things you can try. For details and examples, see “Four Fantastic Table Techniques.”
- Experiment with anchored objects. You can create type in text frames anchored inside a table cell that have a non-rectangular shape.
- Create anchored shapes and use them to change the shape of table cells from rectangular to something a little more interesting.
- Don’t get stuck in a traditional row and column grid. It’s easy to merge cells, or to split them horizontally or vertically. I use this all the time, especially with tables that are acting as the invisible grid for a layout.
You can use this invisible grid technique, turning off all the strokes and the border, when creating step-by-step instructions that include an illustration adjacent to each step. Create a two-column table: one for the instruction text, the other for the image. It makes the layout easy, and your readers will never realize there’s a table on the page.
The possibilities are infinite. I discover new capabilities for tables all the time.
As you work with tables, take the time to experiment, and have fun taking your tables up a notch!
To further inspire your table techniques, click to see these helpful posts from CreativePro:
- Learn how to use graphic cells to create special “endcaps” in tables.
- Create dynamic, easily updated pull quotes using a table.
- Create a different stroke color for two adjacent cells.
- Use cell styles to create a complex diagram.
- Create a “continued” heading for tables that run over multiple pages.
- Don’t lose your cell formatting when updating tables!
- Transpose row and column data (with a little help from Excel).
This article was last modified on December 18, 2024
This article was first published on October 1, 2015
Commenting is easier and faster when you're logged in!

Recommended for you

CreativePro Video: Small Format Presentations
In this week’s CreativePro video, Joe Buchwald, Creative Director for the Adobe...

Working with Strokes in Affinity Designer
Learn how to use the Stroke panel in Affinity Designer to control attributes suc...

Finding the damage in a broken file
How do you fix a file that won't print or has some problems when exporting? Here...