
Printing with high-resolution inkjets is easy and fun, no doubt, but have you really thought about how much it costs? The price of printers is getting cheap enough, but does anyone have any clue as to the cost of each image printed? Nope.
A pair of recent television commercials for consumer inkjet printers reminded me of this missing knowledge. One shows a party where hundreds of photos hang from the ceiling as decorations as well as being placed on the fridge and chairs. The story line is about two roommates pulling pranks on each other, I believe.
In the other, a person takes a panoramic digital photograph of Paris, then prints out the images and pastes them to the walls of her apartment, outdoing David Hockney’s large photo-collages from the mid-1980s.
The characters in these spots must have trust funds from another, more affluent era, since the cost of printing all these images would be costly indeed. Of course, this last, fiscal accounting is missing from the commercials.
My daughter thought the custom wallpaper was a swell idea until we figured the number of images required, and more importantly, the estimated cost for each print. And the cost of the loan she would need to finance such a luxury. They all add up.
Of course, the costs were really guess-timates (please don’t tell my daughter). It wasn’t too hard to find the number of letter-size prints that would be necessary to cover the walls and ceiling of a room. That calculation is simple arithmetic, although you’d want to pad the result a bit. But the cost-per-print part was tough.
Why is it so difficult to predict the true cost of producing a particular image on a printer?
Counting the Variables
If we boil down the printing process to its bare essentials, there are two things that determine the cost of a print: the type and amount of ink placed on a page, and the paper used to hold the ink. That sounds simple enough, right?
However, there are many variables inherent in the simplest print job. In addition, the economics can change when moving a job from printer to printer, or from host to host.
Here are a few variables that can make a difference in the cost of a particular image:
- The image. Each image is different, of course, some bigger and smaller. But different applications and types of images can require varying levels of ink on the page. For example, part of an illustration or a large typographical element may be of a single color, which could require a dense coverage of ink. At the same time, a similar-sized photographic element will usually be made of pixels of many colors, even thought it all looks “red.”But “coverage” can be a flexible term. Some images may have similar coverage if you count the pixels and the white space remaining on the sheet. Still, each appears much different and uses different amounts of inks (see Figure 1). A page loaded with text could use more black than a photographic image. Or not. It depends on the image. Pick blonds over brunettes if your black cartridge is running low.
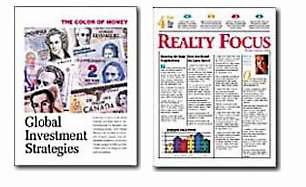
Figure 1: According to a Lexmark marketing piece, both of these images have 30 percent coverage. Still, the one on the right is grayer (text-heavy) than the other. As always, the white you see is the color of the paper.
- The OS. Layouts are comprised of images and text, and operating systems handle fonts differently. Macs and Windows systems show fonts at different sizes as well as displaying differences in the glyphs themselves. While these differences are slight, they could mean more, or less ink on a page when printing.
- Printer resolution. Most of the time we consider extra resolution as a benefit. When it comes to ink consumption, however, higher resolution means more ink will be used to fill-in edges of lines and fonts, and thus more cost.
- Driver settings. There are many printer settings that can change the default ink levels (see Figure 2). Some are for saving ink, such as the Economy mode, while other controls let users add more ink (saturation) to accommodate the differences in absorption characteristics of paper and surfaces.

Figure 2: Here’s Epson’s printer dialog box in Mac OS 9.2. The ink-saving Economy mode only works for plain paper and lower resolutions. It also let me boost the saturation of colors in the output with the advanced settings option.
There are more items for this list, such as the environment (dry or humid), and even peculiarities of the printing technology itself (laser vs. inkjet).
The Average Page
Despite these variables in printing, there are several standards commonly used to rate ink usage by printer vendors. Most are older standard pages in black-and-white text, which were also used to evaluate “business printing,” including fax machines and copiers.
The most familiar is the “5-percent page,” which is a theoretical page with about three or so paragraphs of text. You will often see ink cartridges rated as “4,000 pages at 5% coverage.”
In a similar vein, there’s the Dr. Grauert Letter (ISO 10561) that some vendors use as a 5-percent page (see Figure 3). The ink coverage of this business-style page is actually a bit over 3 percent. You will sometimes see both the 5 percent and Dr. Grauert figures mentioned in vendor specification sheets.
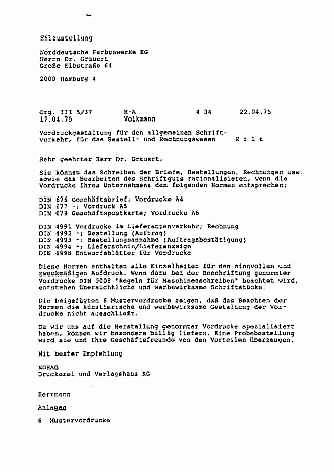
Figure 3: This business letter — written in German, so don’t strain to read it — is actually an ISO standard for printers. Go figure. It’s addressed to Herr Doctor Grauert, or Dr. Grayed. Its coverage is “approximately” 3.2 percent.
These metrics are abstract, especially for color printers. And they can be fudged through the differences between the 8.5-inch letter and A4 sheets (both are considered “pages” although they differ in size, so 5 percent on letter-size paper is certainly different than 5 percent on an A4 sheet), as well as the frequent differences between the selected sheet size in the driver and the actual printable area on the page. These are small differences but they can add up for a cartridge.
These tricks and more are outlined in an amusing 1998 report by the Business Equipment Research & Test Laboratories called Printer Consumable Marketing Methods. “Whilst sourcing toner cartridges for our tests, our research team and buyers were surprised at the lack of standardized information on products. We concluded that it is extremely difficult for a buyer to tell a good value product from a poor value product. …”
Whilst?
Color Costs in the Real World
By any measure, the standard pages above are business-oriented — meaning mostly text and little color. On the other hand, work by creative professionals requires much greater coverage on a page — and lots of color.
Yet the printer industry is really no closer to providing color professionals (or anyone else for that matter) with reliable estimates of page costs.
“Determining the cost per page (we cite the cost per average page, rather than the cost of a black page or a color page) is the challenging part,” according to a PC Magazine review of consumer inkjet printers by Jeremy Kaplan. However, things get complicated quickly.
“We started with the cost of a regular-capacity black cartridge, rather than the high-capacity or starter cartridges sometimes supplied; divided it by the number of pages printed before the black ink ran out; and multiplied this figure by 62.5 percent. The 62.5 percent figure is important because of the nature of our test target. Half the target is text, and half is color; remember that black makes up one-quarter of the color half as well. …”
Argh! Break out the spreadsheet.
Royce Bair, director of Salt Lake City-based Inkjet Art Solutions offers Internet readers the results of his company’s in-house testing of a variety of large-format and desktop Epson proofers. It’s a very interesting and detailed analysis of the printers, including the costs involved with printing to about two-dozen types of media.
He observed that it’s easy to underestimate the coverage of photographic images such as this PhotoDisc test image (see Figure 4). “Images of people consume a lot of ink. That’s because even fair-complexion flesh tones can average over 50% yellow and over 50% magenta coverage. The four ‘people’ images at the bottom of the PhotoDisc test target have an average coverage of over 34% per color (CMY), despite less cyan coverage (27%) and the white background behind their heads.”

Figure 4: This PhotoDisc test image is really designed for evaluating images and cameras rather than determining the costs. According to Bair, it averages almost 36-percent coverage for colors and 22 percent for black. That’s a huge leap from the 3.2-percent black coverage of the Dr. Grauert standard.
Still, the cost of printed pages is important when pricing jobs for your clients and making a supplies budget for the year. If printer vendors and published reports can’t provide accurate cost information, you will have to do it yourself.
Most of us will find it impractical to actually run a new ink cartridge until it’s dry. Instead, keep a running log of all the pages printed on a set of cartridges, dividing the pages into several categories, such as full-color page, half-color page and mostly text. Be sure to include all of the pages you print, including misfeeds and Web pages. Everything counts. After you reach the end of the ink, tally up the pages and do the math.
Still, that will only be part of the cost. As the rabbinic saying reminds us: “Half an answer also tells you something.” You will then have to add in the cost of the paper. That’s the “hard” part of hardcopy.
This article was last modified on January 3, 2023
This article was first published on May 8, 2003
Commenting is easier and faster when you're logged in!

Recommended for you

Compositing a Scene into a Head in Photoshop
However much you may toy with people’s expressions using the Liquify filte...

CreativePro Tip of the Week: Increasing the Photoshop Canvas Size with the Crop Tool
This CreativePro Tip of the Week on Increasing the Photoshop Canvas Size with th...

Top 5 Lightroom 5 Resources
It has been a week since Adobe announced the availability of the Lightroom 5 bet...