

This article introduces Visual Studio Code (VSCode) with the ExtendScript Debugger extension as an alternative for debugging ExtendScript. Think of it as a cookbook and try to follow the recipe below. You’ll gain confidence and understanding when it comes to using VSCode.
Introduction
First, a bit of background for folks without scripting experience. ExtendScript is a scripting language and tools that Adobe created to automate tasks within its Creative Suite (now Creative Cloud) apps. ExtendScript Toolkit (ESTK) is a tool for debugging ExtendScript scripts. For many years, these tools have been used by scripters worldwide to develop scripts for Photoshop, InDesign, Illustrator, and other apps. Unfortunately, ESTK is not compatible with newer versions of macOS (10.15 Catalina and after). On Windows and on older versions of macOS, ESTK is still available, at least, if you know where to look.
JavaScript for InDesign
If you’re an InDesign user/scripter, you are probably aware of Peter Kahrel’s excellent book, JavaScript for InDesign. If you’re new to scripting InDesign, this book is required reading.
The book was written well before the ExtendScript Debugger became available. So, naturally it makes little mention of ExtendScript Debugger.
If you are a Mac user, this article will help you make good use of the book by showing you how to use the ExtendScript Debugger instead of ESTK.
Visual Studio Code
Visual Studio Code (VSCode) is an Integrated Development Environment (IDE), created by Microsoft. You can download and use the tool for free here.
An IDE is a powerful text editor combined with tools for running and debugging software source code. An IDE can be used to write software in many different computer languages.
The VSCode IDE has a plug-in/extension architecture. By itself, it is just a powerful text editor, and not really a debugger. You need to add one or more extensions to VSCode to support any programming language.
ExtendScript Debugger Extension
ExtendScript Debugger is a VSCode extension created by Adobe.
You can download and install the ExtendScript Debugger from the VSCode Marketplace. The VSCode Marketplace is a built-in feature of VSCode.
ExtendScript Toolkit
If you have a Windows computer, or a Mac with an older version of macOS (Mojave or older), then ExtendScript Toolkit remains a viable option to use for a debugger.
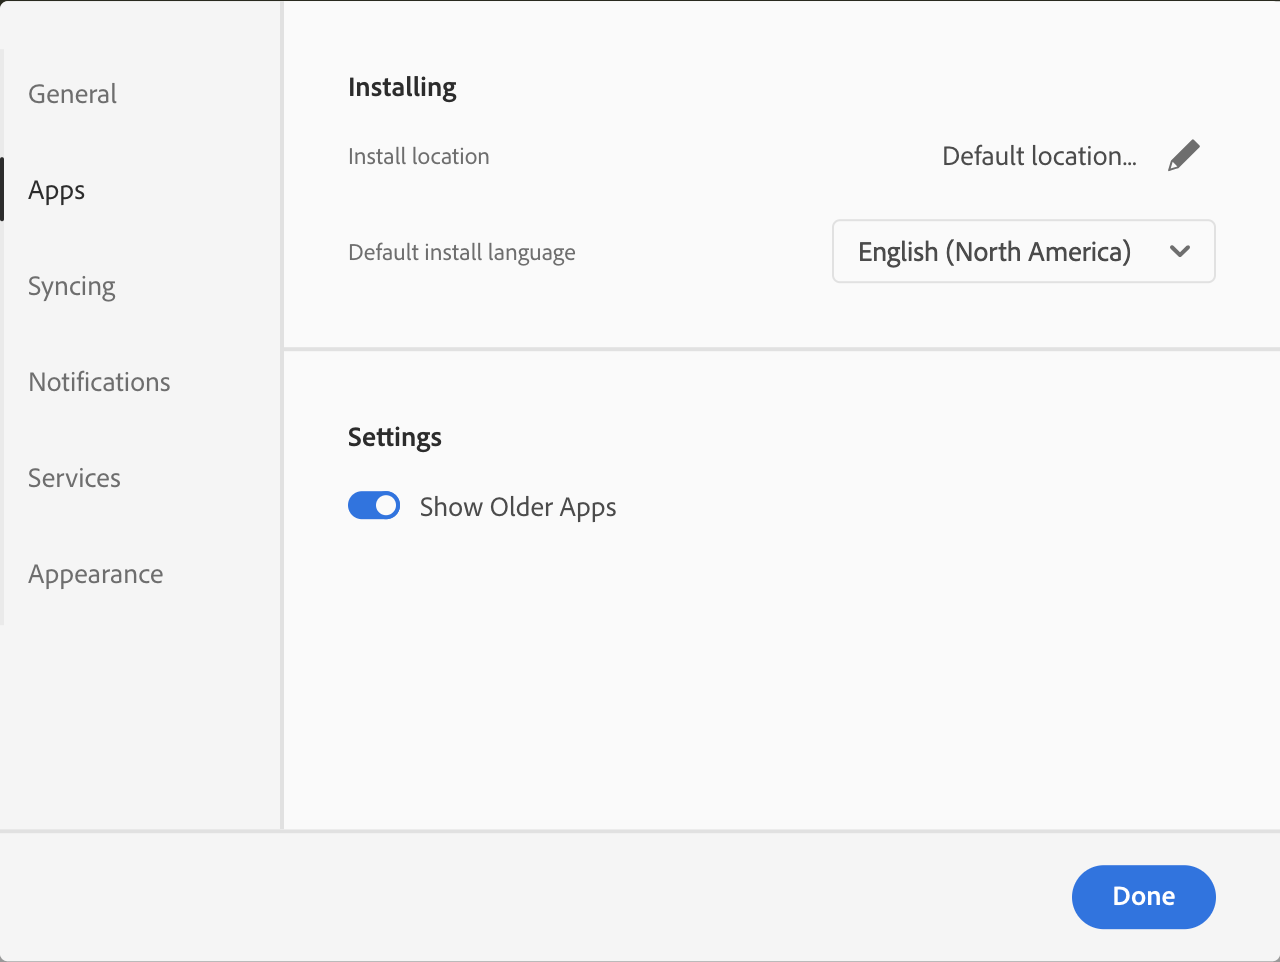
Open the Apps Preference of the Creative Cloud Desktop app. If the option Show Older Apps is available in the Apps Preference of the Creative Cloud Desktop app, you can enable it and this will allow you to install ESTK, but only if ESTK can run on your computer.
You can even have both ESTK and VSCode installed side-by-side on the same computer.
Trying to switch back and forth between the two can get confusing as one will often ‘block’ the other. It’s best to only use one or the other – and not try to switch between the two.
Your Computer CPU Architecture
Before you can dive into developing and debugging, you need to determine the CPU architecture used by your computer.
Windows
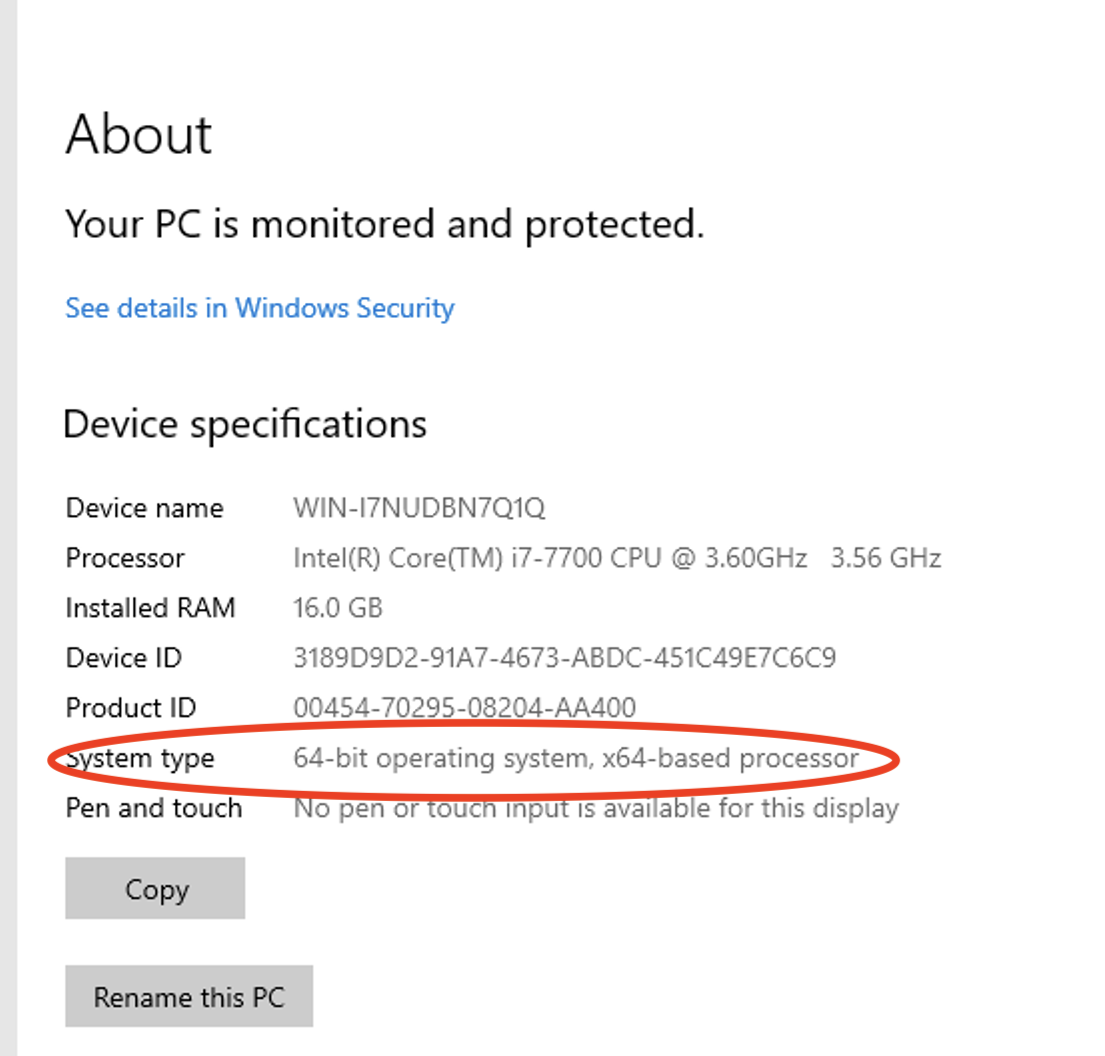
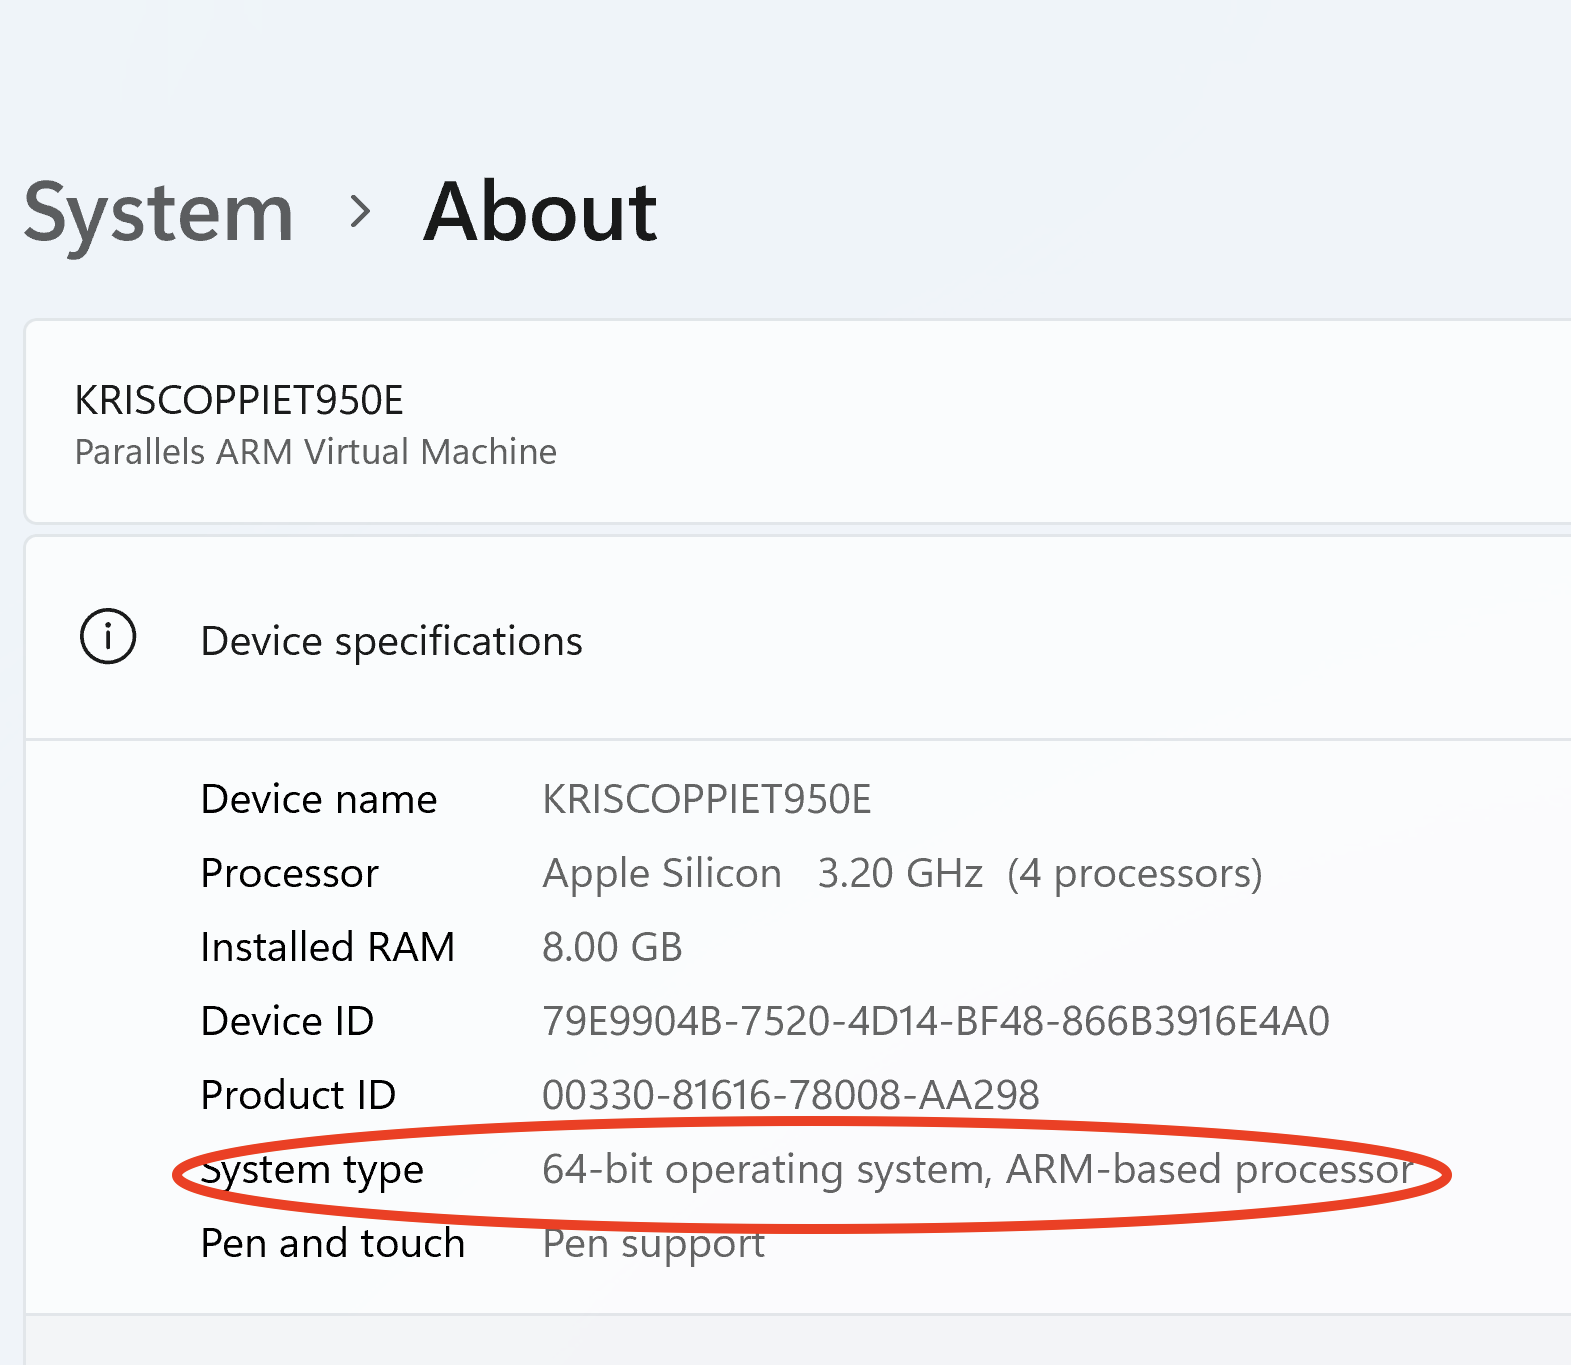
On Windows, your computer could either have a 64-bit Intel CPU (often referred to as x86 or x86-64) or an ARM CPU (often referred to as ARM, ARM64…).
Click the Start button and in the search box, type About. Click the option About your PC.
This shows you what kind of CPU your computer has.
Mac
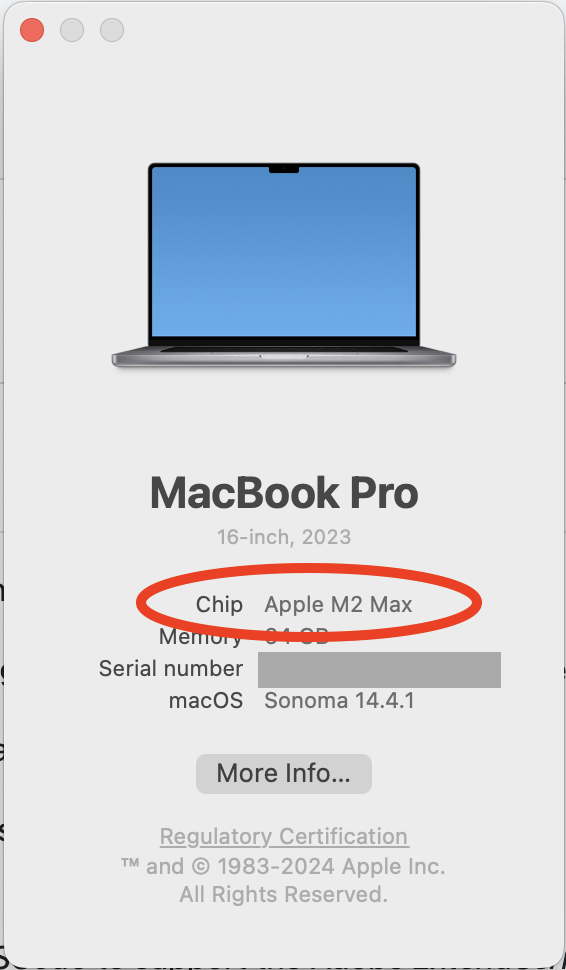
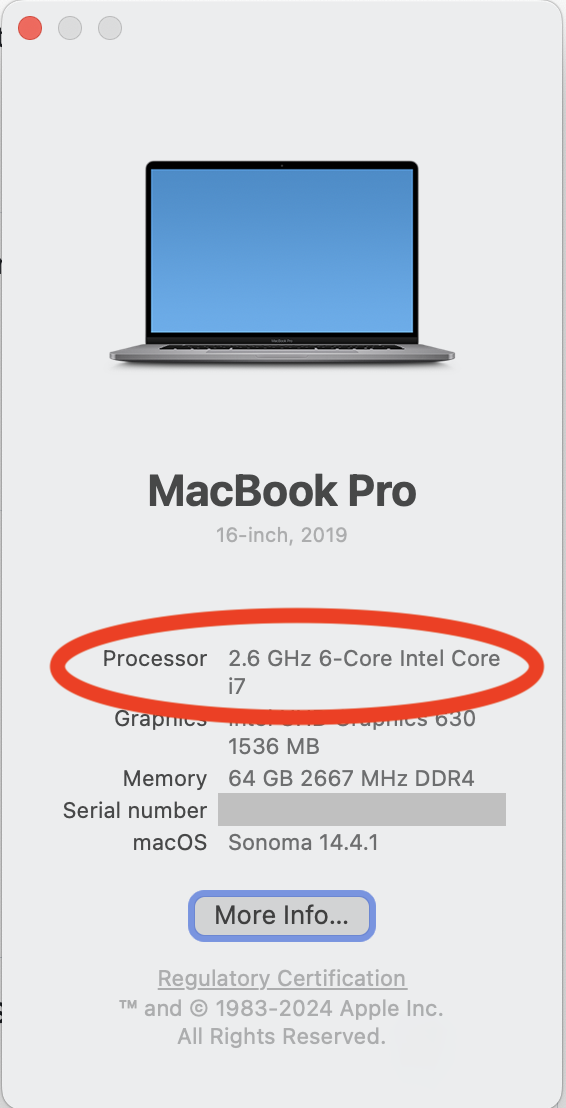
If you have a Mac, your computer either has a 64-bit Intel CPU (often referred to as x86 or x86-64) or a 64-bit Apple ARM CPU (often referred to as M1, M2, ARM, ARM64, Apple Silicon…).
Check About this Mac under the Apple menu to see which it is.
CPU Architecture Overview
Whether you can use ExtendScript Toolkit or need to use VSCode + ExtendScript Debugger depends on the architecture of the CPU in your computer.
| VSCode + ExtendScript Debugger | ExtendScript Toolkit | |
| Windows x86-64 | Y | Y |
| Windows ARM64 | N | N |
| Recent macOS on x86-64 | Y | N |
| macOS on ARM | *Y | N |
| macOS – Mojave or older | Y | Y |
| *=needs to use Rosetta mode |
Additional Notes on CPU Architecture
Some additional notes regarding specific CPU architectures.
macOS on ARM needs Rosetta
If you have multiple options to choose from on the download page, you need to pick the Mac Universal version of VSCode.
Before you can use the ExtendScript Debugger on a Mac with an ARM-based CPU, you need to enable Rosetta mode.
Once downloaded and installed, locate the icon for the Visual Studio Code application in the Finder, right-click it and enable the option Open Using Rosetta.
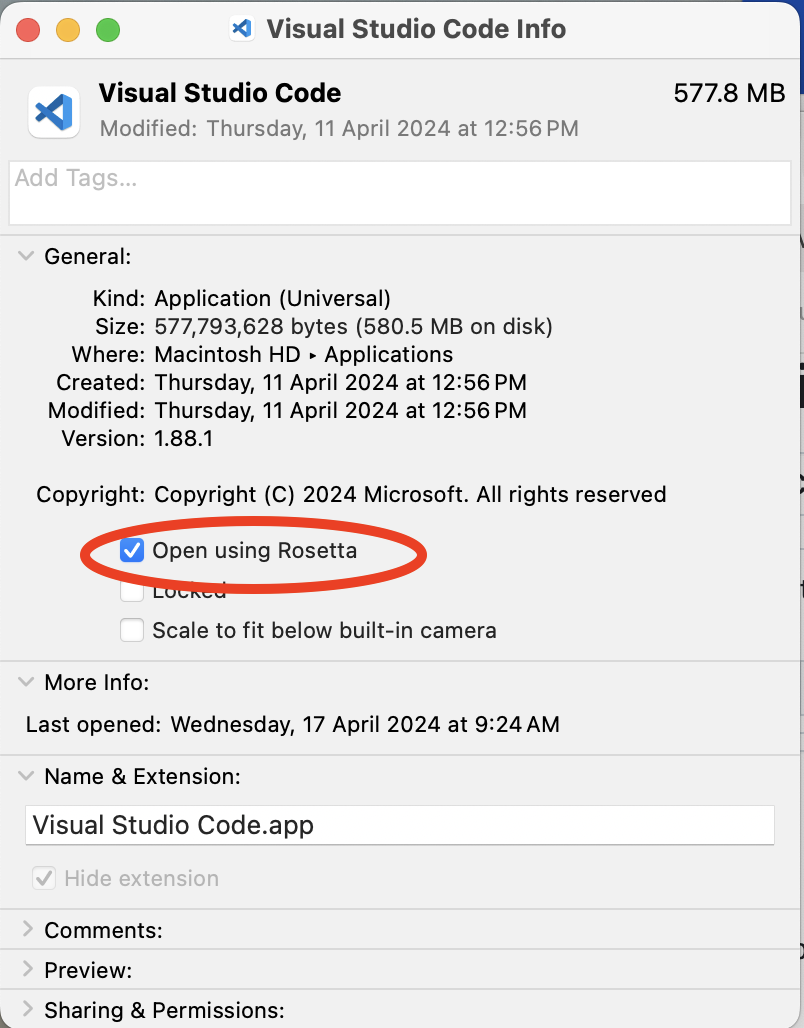
Start or restart VSCode. From this point onwards, the ExtendScript Debugger extension will work.
There are a few gotchas.
- Each time you update VSCode, or allow it to update itself, you might need to re-enable the Open using Rosetta option.
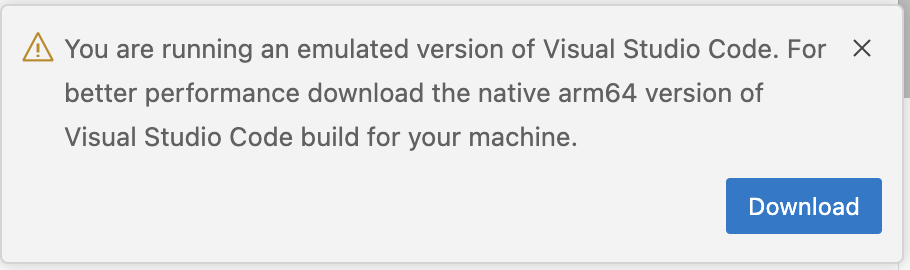
- Each time VSCode launches it will complain that you are running an emulated version. Ignore the complaint and do not click Download.
Windows on ARM
If you can, avoid using this type of computer for ExtendScript software development.
The Adobe Creative Cloud is not (yet) well supported by the Creative Cloud on Windows running on an ARM processor.
At the time of this writing, only Acrobat, Lightroom, and Photoshop seem to be supported.
Mac on macOS Mojave or older
If you use a macOS Mojave or older, you might also need to use older versions of the various components.
Getting the ExtendScript Debugger extension
To get ExtendScript Debugger to work, you need to launch VSCode and click the Extensions activity on the Activity bar.
The activity bar is most commonly a strip left of the screen with a number of icons on it.
You can hover your pointer over the icons to see what they do: Explorer, Search, Source Control, Run and Debug, Extensions, and so on.
Click the Extensions activity.
Type the word ExtendScript into the search text box, top left, below the title ‘EXTENSIONS: MARKETPLACE’.
In the results, pick ExtendScript Debugger by Adobe.
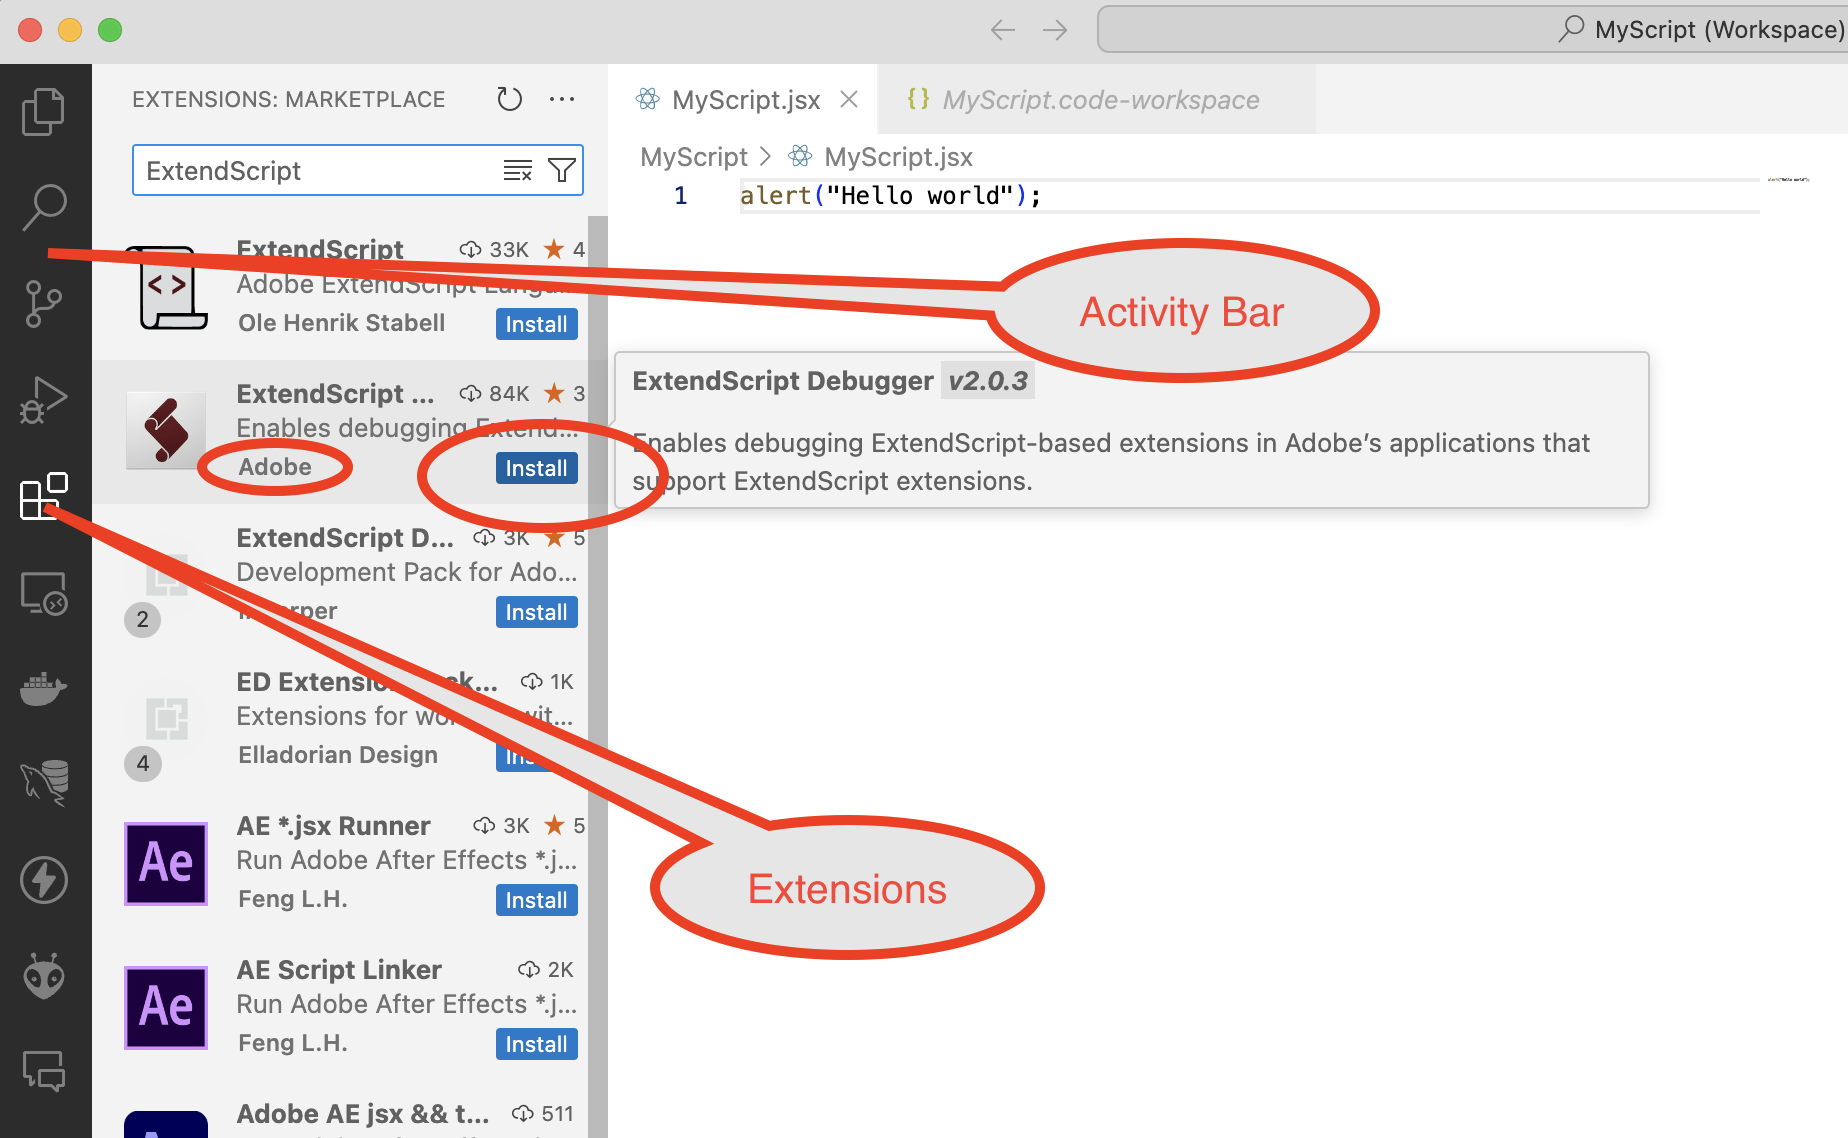
Click the small Install button and allow VSCode to install the extension.
Workspaces
VSCode keeps all files related to your scripting project together in a workspace.
When developing with ESTK, often the only file you deal with is just a script file (e.g. MyScript.jsx), no additional files needed.
VSCode, on the other hand, uses workspaces. A workspace is a folder (or collection of folders) that contains your script file, as well as some additional VSCode files that contain information about your script file.
If your script relies on #include … or //@include … files you also store these additional files into the workspace folder.
Setting Up
In the cookbook below, I’ll describe just one way to set up and use VSCode. Note that there are many other ways to set VSCode up correctly.
First move your script file (say, MyScript.jsx) into a folder. Use the same name as the script file for the folder. For example, if you have a script MyScript.jsx, create a folder MyScript and move the script file into that folder.
Inside the MyScript folder, create a nested subfolder called VSCode.
> MyScript
    MyScript.jsx
    > VSCode
Leave the VSCode folder empty for now. You’ll use it for some VSCode files.
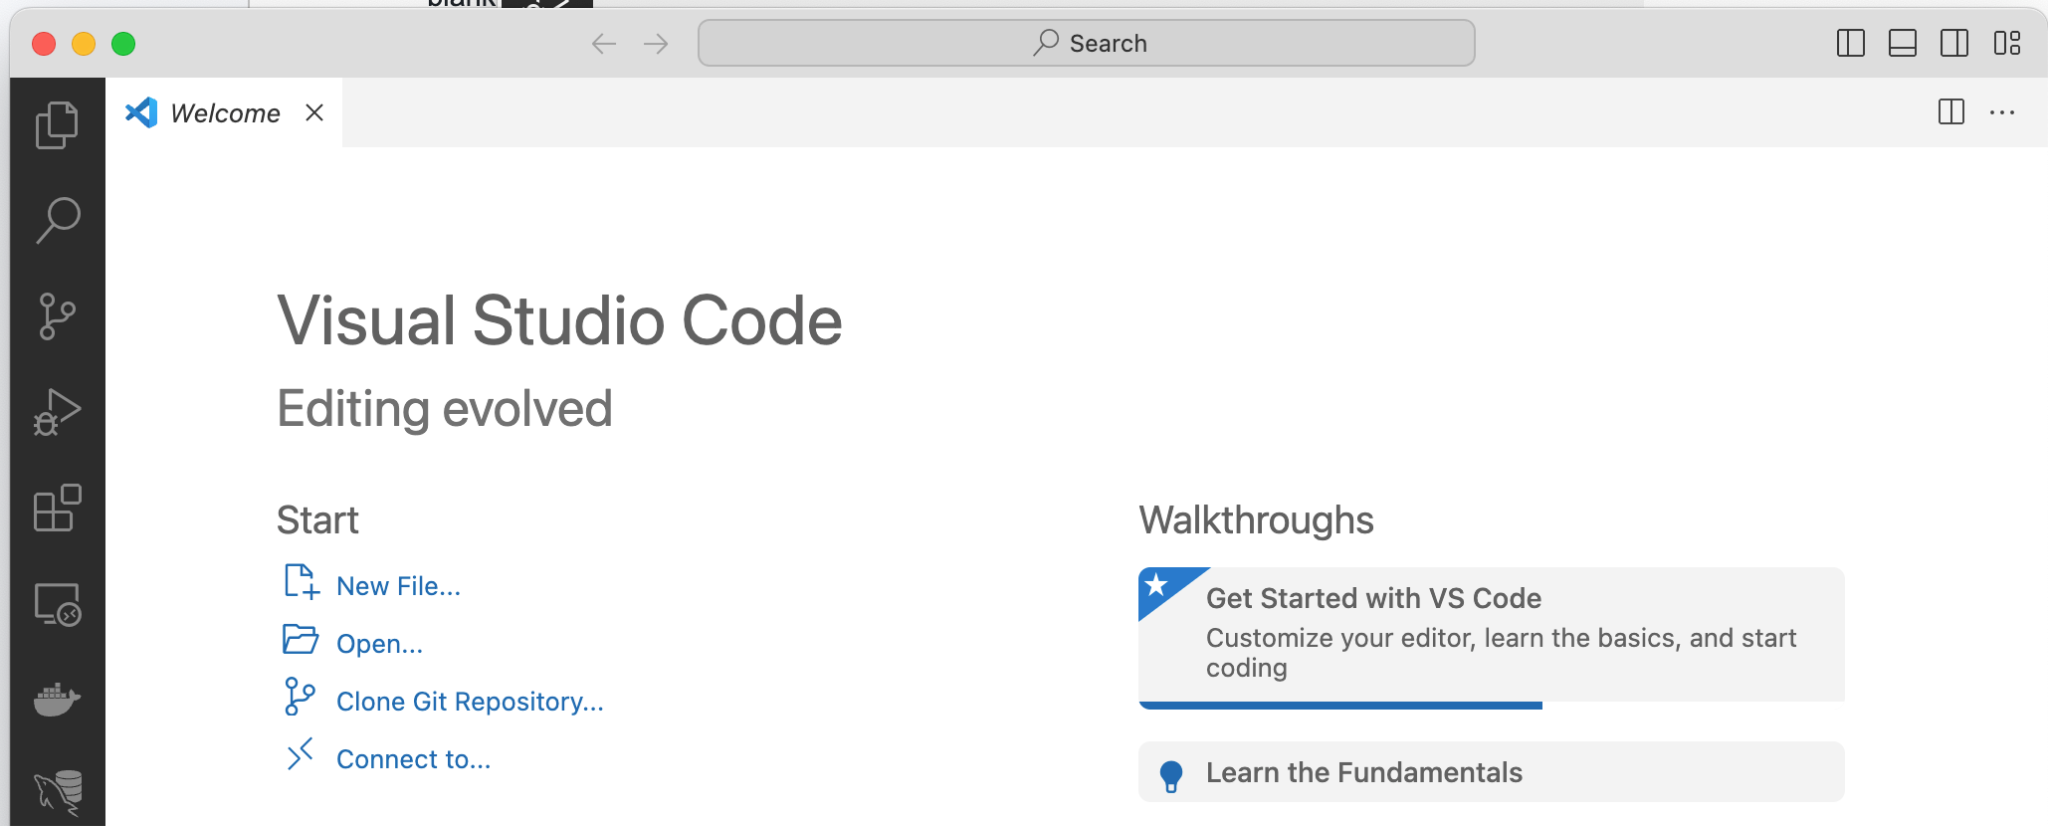
Launch VSCode. VSCode remembers what you were doing last time you used it, so the window you see might not be a generic Welcome or blank window. If the window you are presented with is not a blank, choose the File > New Window to get a blank new window, with just the Welcome showing.
Choose File > Add Folder To Workspace. In the folder selection dialog box, locate and select the folder MyScript.
Next, choose File > Save Workspace As and save the workspace file into the empty MyScript/VSCode subfolder as MyScript.code-workspace.
This makes the MyScript folder into a small, self-contained unit.
> MyScript
    MyScript.jsx
    > VSCode
      MyScript.code-workspace
Editing
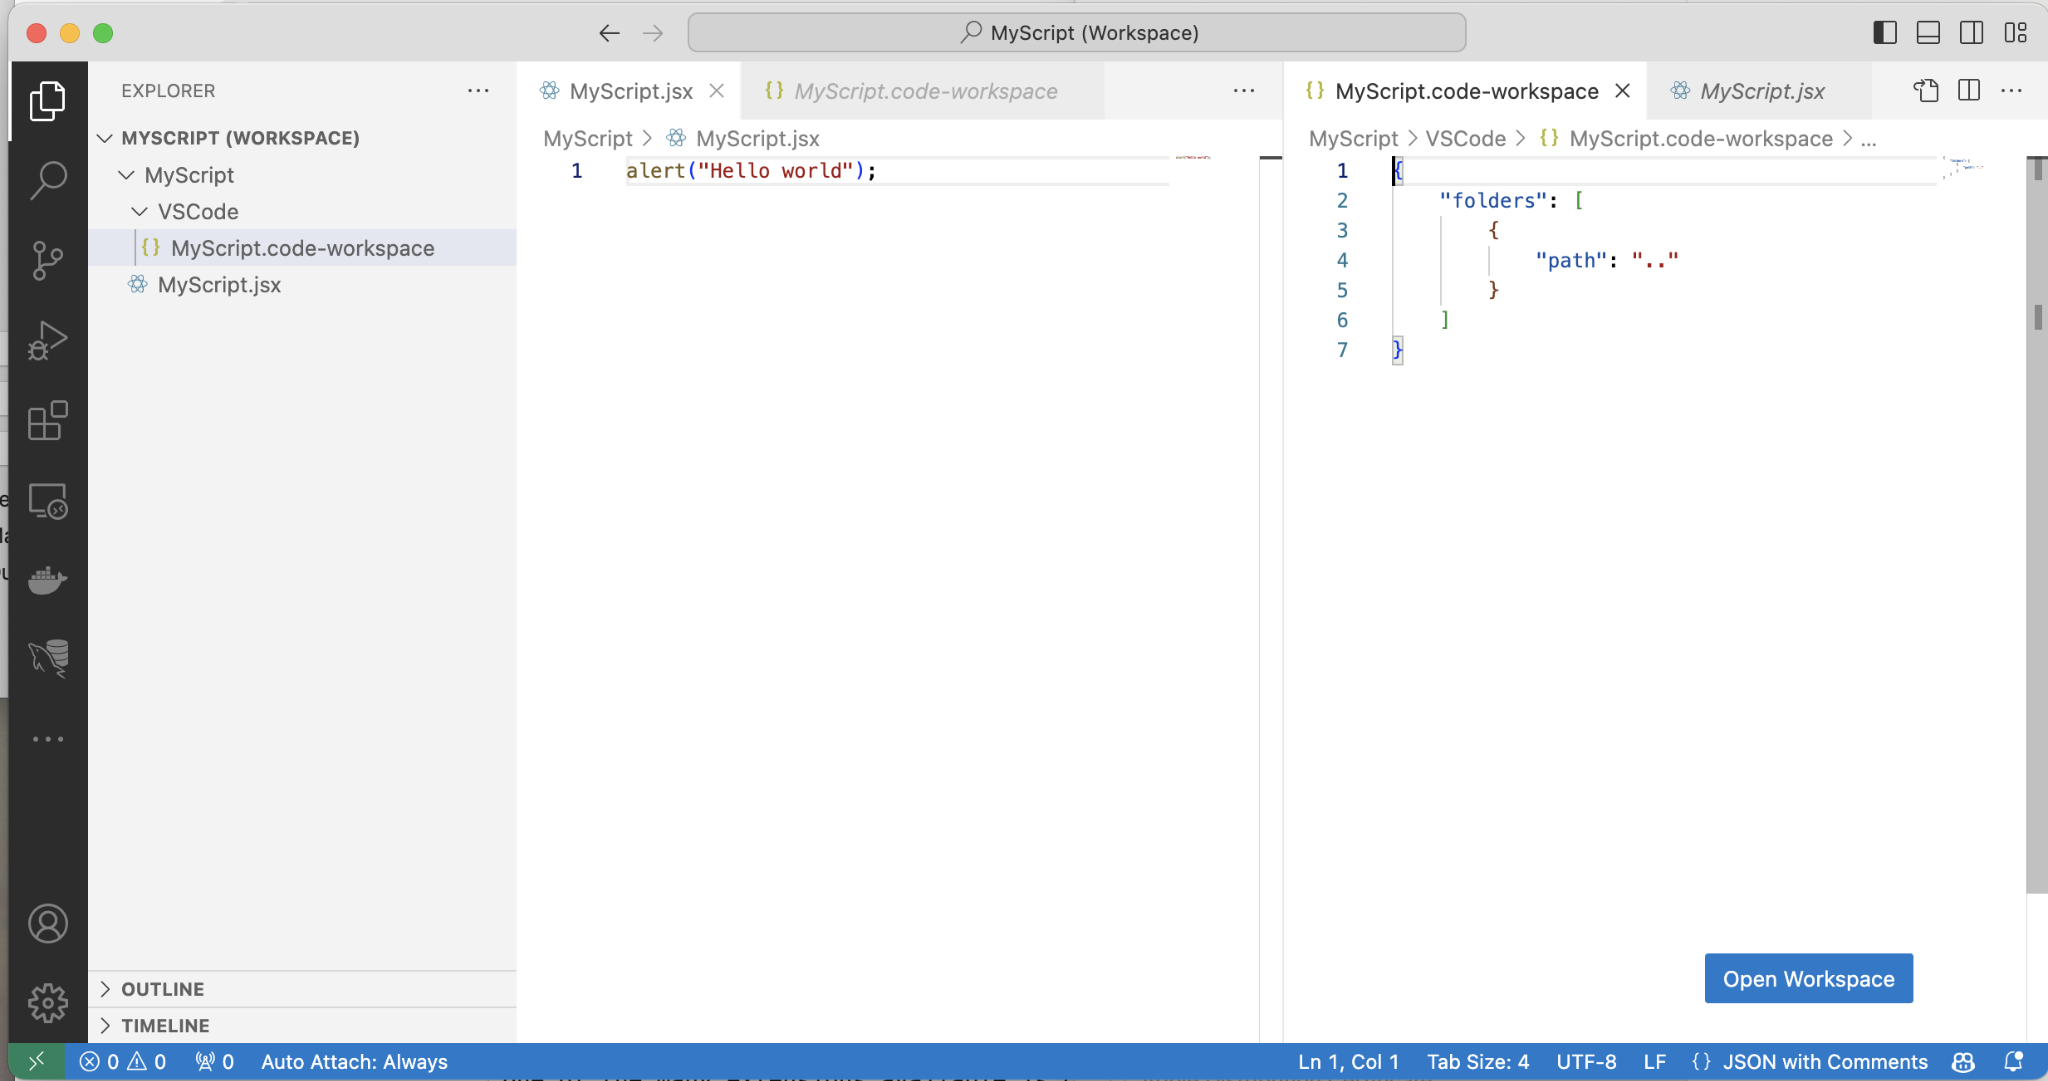
Click the Explorer activity icon on the Activity bar to see your workspace and the script folder.
Click the MyScript.jsx to open the script in the text editor.
In the screenshot below, I’ve split the editor window and I also opened the MyScript.code-workspace file.
Note that MyScript.code-workspace is just a text file.
It is worthwhile to spend some time familiarizing yourself with the text editor.
Preparing for Debugging
Before you can run or debug the script, you need to prepare VSCode and give it some more info about the script.
Click the Run and Debug activity icon on the Activity bar.
Click the words create a launch.json file.
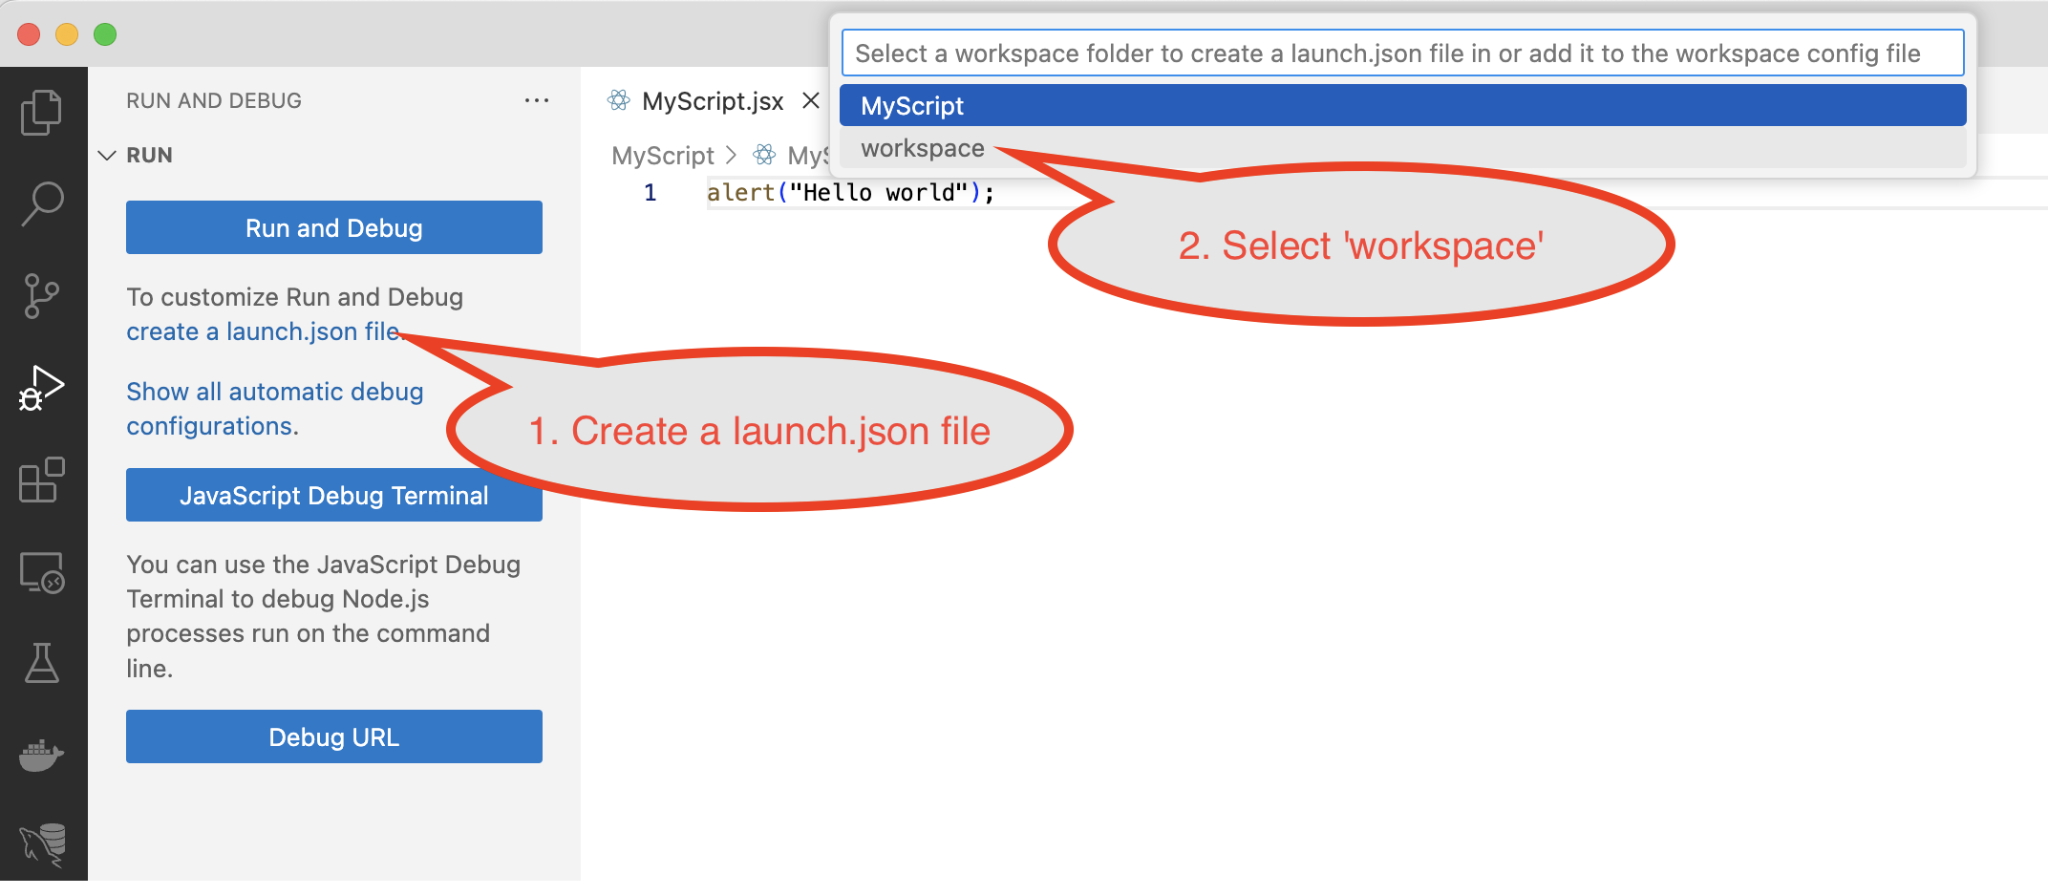
Select the word workspace from the top dropdown menu.
A second dropdown menu appears. Select the word ExtendScript from the next dropdown menu.
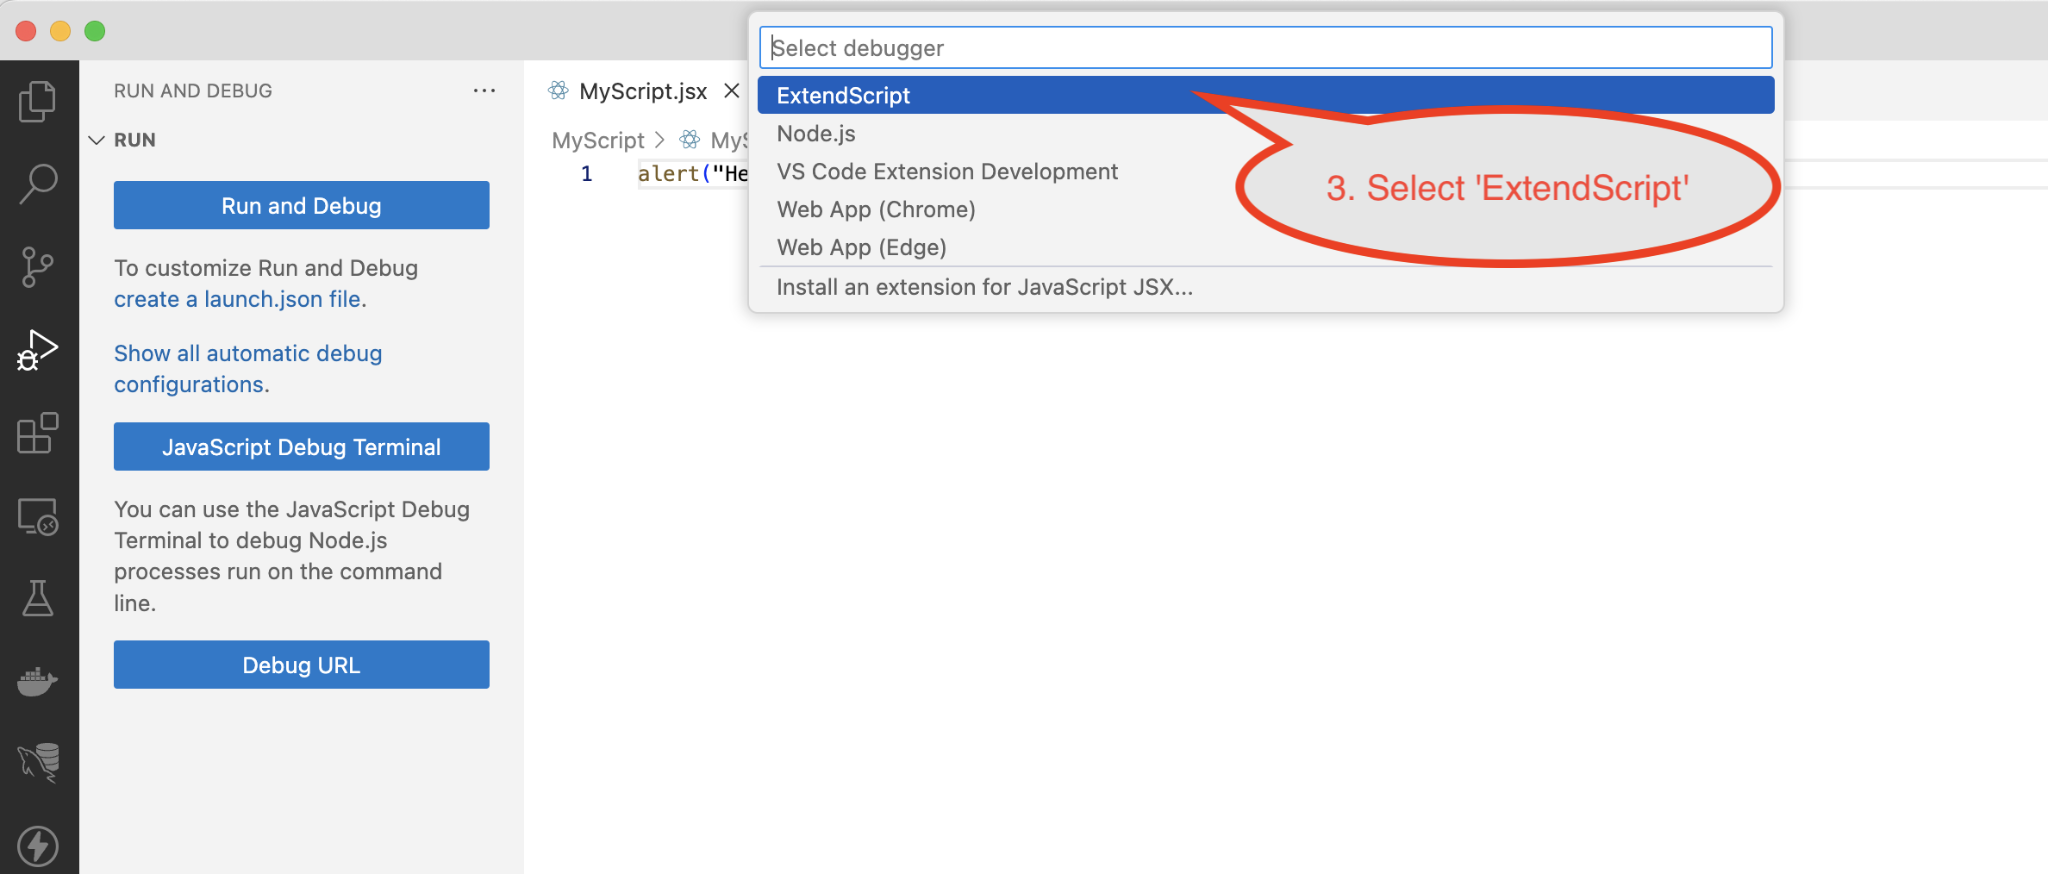
If you see no ExtendScript option, it may be because the ExtendScript Debugger extension was not correctly installed, or it was disabled in VSCode. Go back, retrace your steps, and double-check all the preliminary steps outlined earlier in this article. Make sure you did not skip one of them.
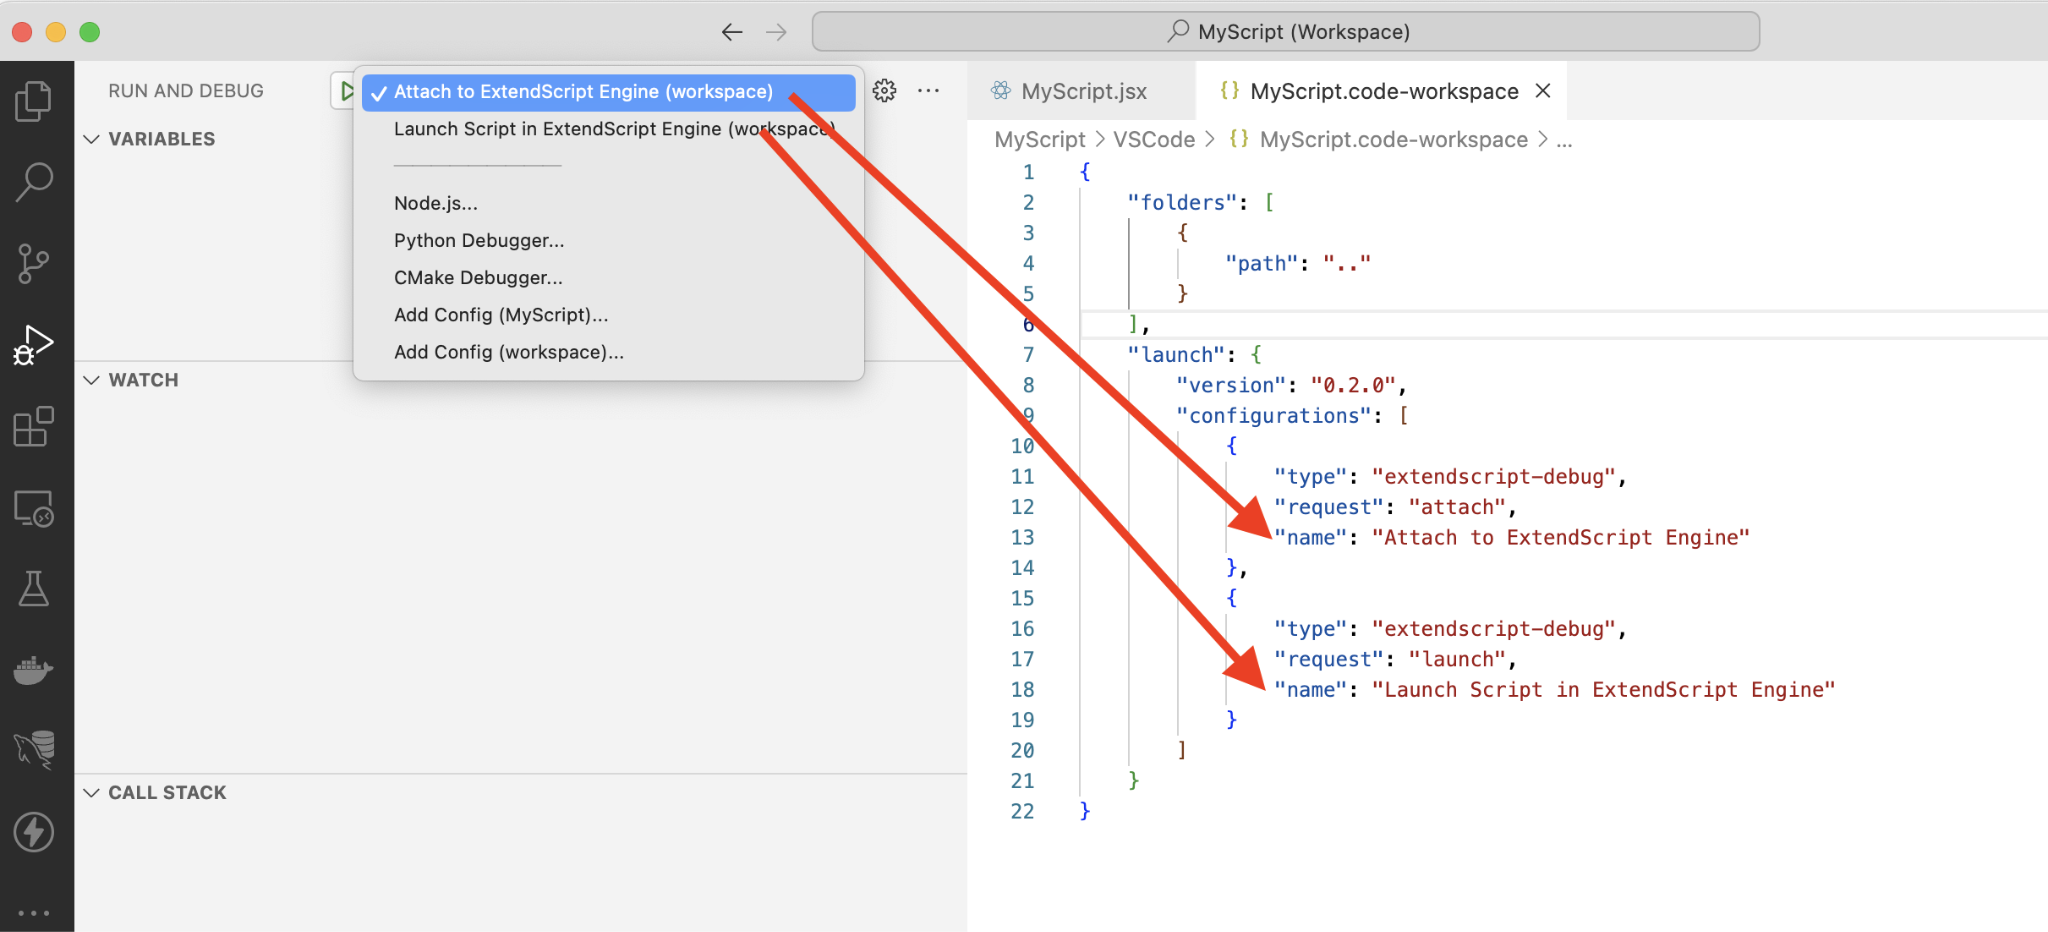
Use the Explorer activity and click the workspace file, MyScript.code-workspace.
Note that the file contents have changed, and two sample ‘debug configurations’ have been added by VSCode.
{
    "folders": [
        {
            "path": ".."
        }
    ],
    "launch": {
        "version": "0.2.0",
        "configurations": [
            {
                "type": "extendscript-debug",
                "request": "attach",
                "name": "Attach to ExtendScript Engine"
            },
            {
                "type": "extendscript-debug",
                "request": "launch",
                "name": "Launch Script in ExtendScript Engine"
            }
        ]
    }
}
These are just samples, good starting points. You can customize and add as many debug configurations as you like.
Any debug configurations listed in the workspace file are also shown in the dropdown menu in the Run and Debug activity.
JSON files
The workspace file uses the JSON (JavaScript Object Notation) file format, and you can edit the workspace file with the VSCode text editor.
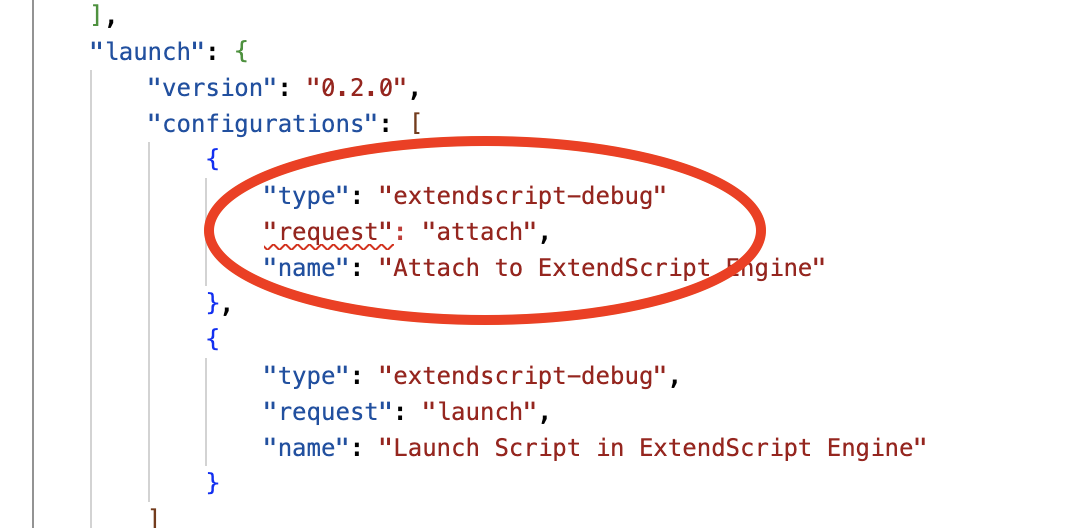
Note that any JSON file is “brittle.” You could very easily type or remove a wrong character and “break” the file, just as it is with .jsx files.
For example, a JSON file will break when you use ”curly quotes’ instead of regular “quotes’, or when you open a curly brace { without counterbalancing it with a closing brace }.
Just like when editing .jsx files, you have to be careful at all times, otherwise you might need to closely retrace your steps when things go wrong.
If (more likely when) you do break the file, VSCode will sometimes try to help you by adding squiggly lines. However, this is not a given: The file can be broken, yet no squiggly lines show up.
In the example below, I omitted a comma at the end of the previous line, which made VSCode add a squiggly line under request.
Don’t forget about the VSCode Marketplace. If (and when) things get complicated: there are ample VSCode extensions available specifically for dealing with JSON files.
Debugging the script
I’ll use the following little script to test out the debugger. You can use your own script instead, or you can copy the code below.
(function(){
function reverseString(str) {
    var splitStr = str.split("");
    var reverseSplitStr = splitStr.reverse();
    var reverseStr = reverseSplitStr.join("");
    return reverseStr;
}
var yourName = prompt("Please enter your name","","Your Name");
var yourReverseName = reverseString(yourName.toLowerCase());
alert("Your name in reverse is '" + yourReverseName + "'");
})();
Launch the target application. I used InDesign 2024 for this example.
Double-click MyScript.jsx in the Explorer activity so it opens in a text editor window.
Switch to the Run and Debug activity and perform the six steps shown in the screenshot below, in turn.
After step 3, you will need to provide VSCode with some info: What application should run the script? Again, I picked InDesign 2024 from the dropdown menu.
If you also picked InDesign for your targeted application, VSCode will continue on to ask what engine should the script be run in? I picked main from the dropdown menu.
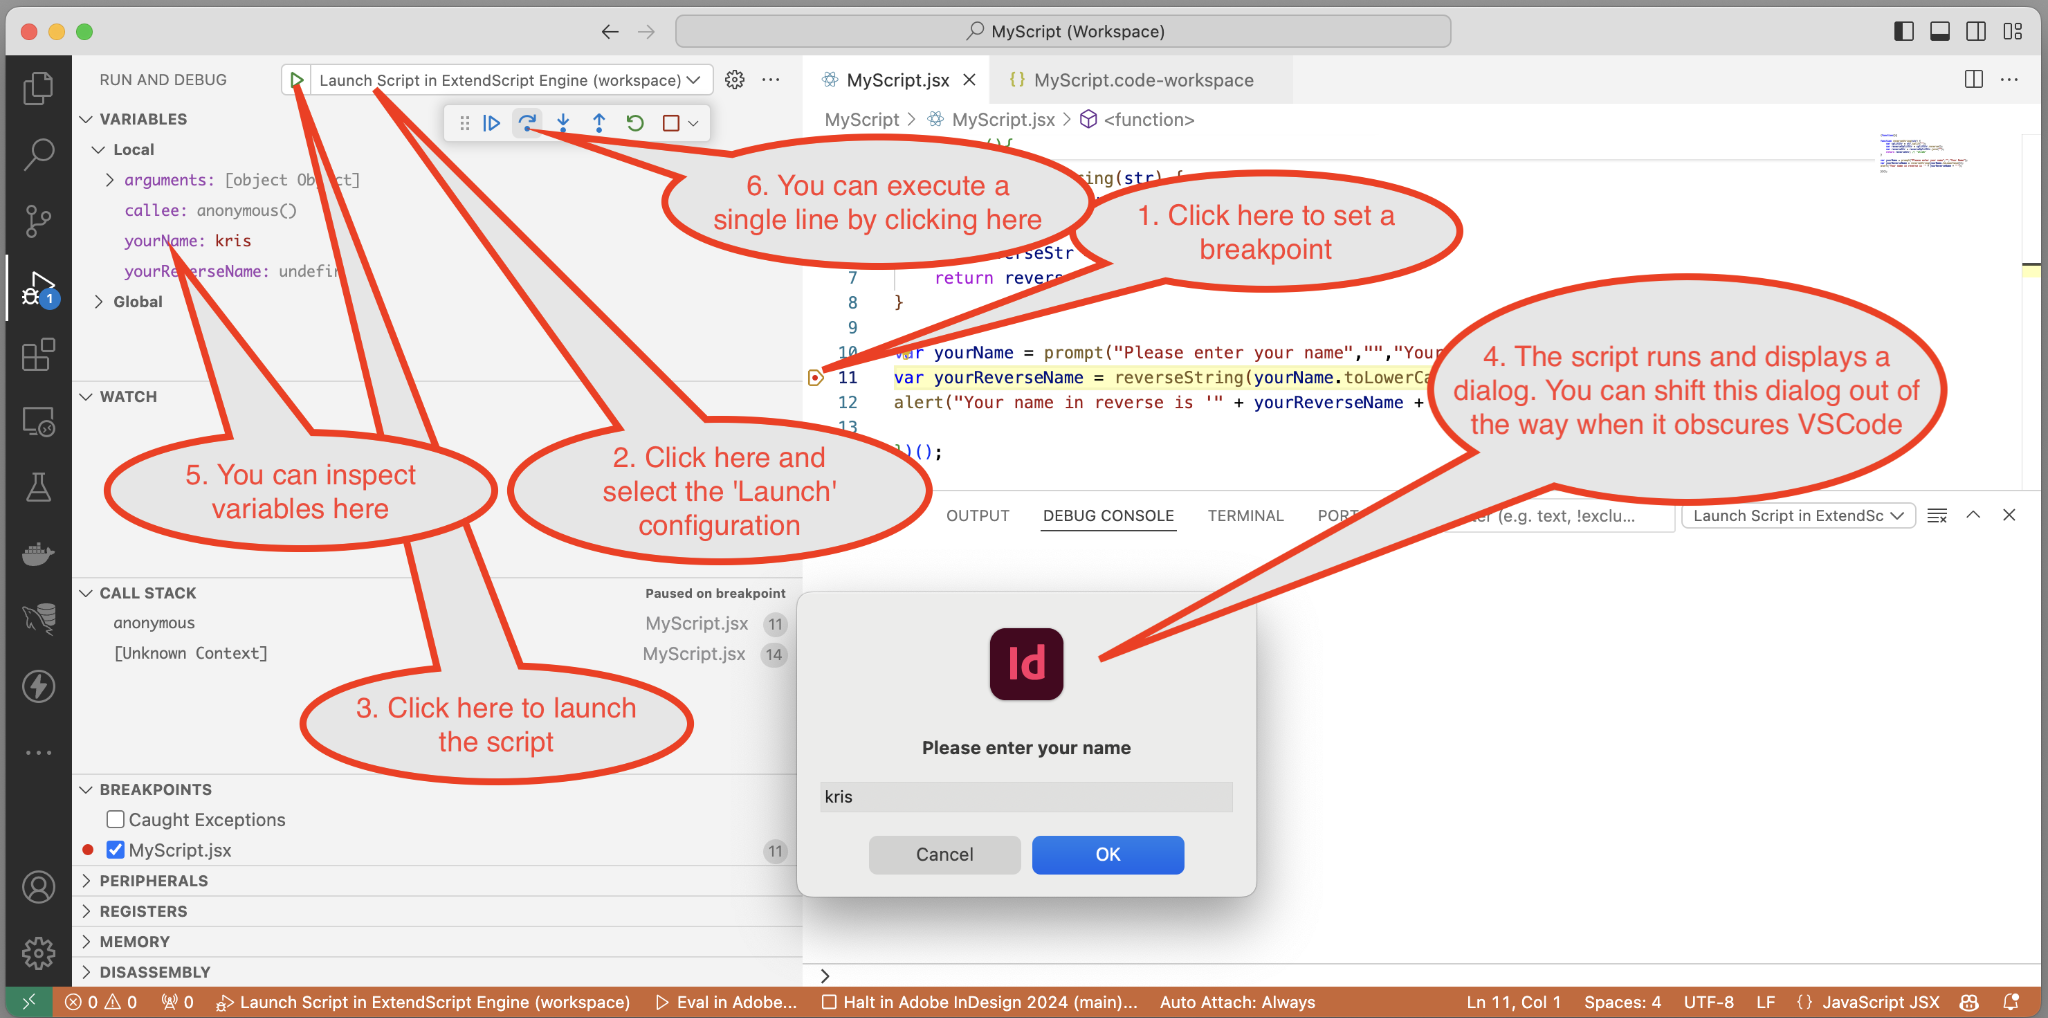
You can now set breakpoints in the source code by clicking in the left-hand margin of the editor window.
Then click the Run button on the small floating panel to let the script run.
Tweaking the Debug Configuration
This article only covers how you can get started with VSCode. There are many options available, all beyond our scope here.
If you want to get a taste (and a peek at the many configuration options of the ExtendScript Debugger) open up the workspace file and put your text cursor inside one of the existing debug configurations.
Type just a double quote, as if you’re about to add an additional configuration option.
VSCode will show a menu with all the available options. You can use the up/down keyboard arrows to browse through them and see short descriptions.
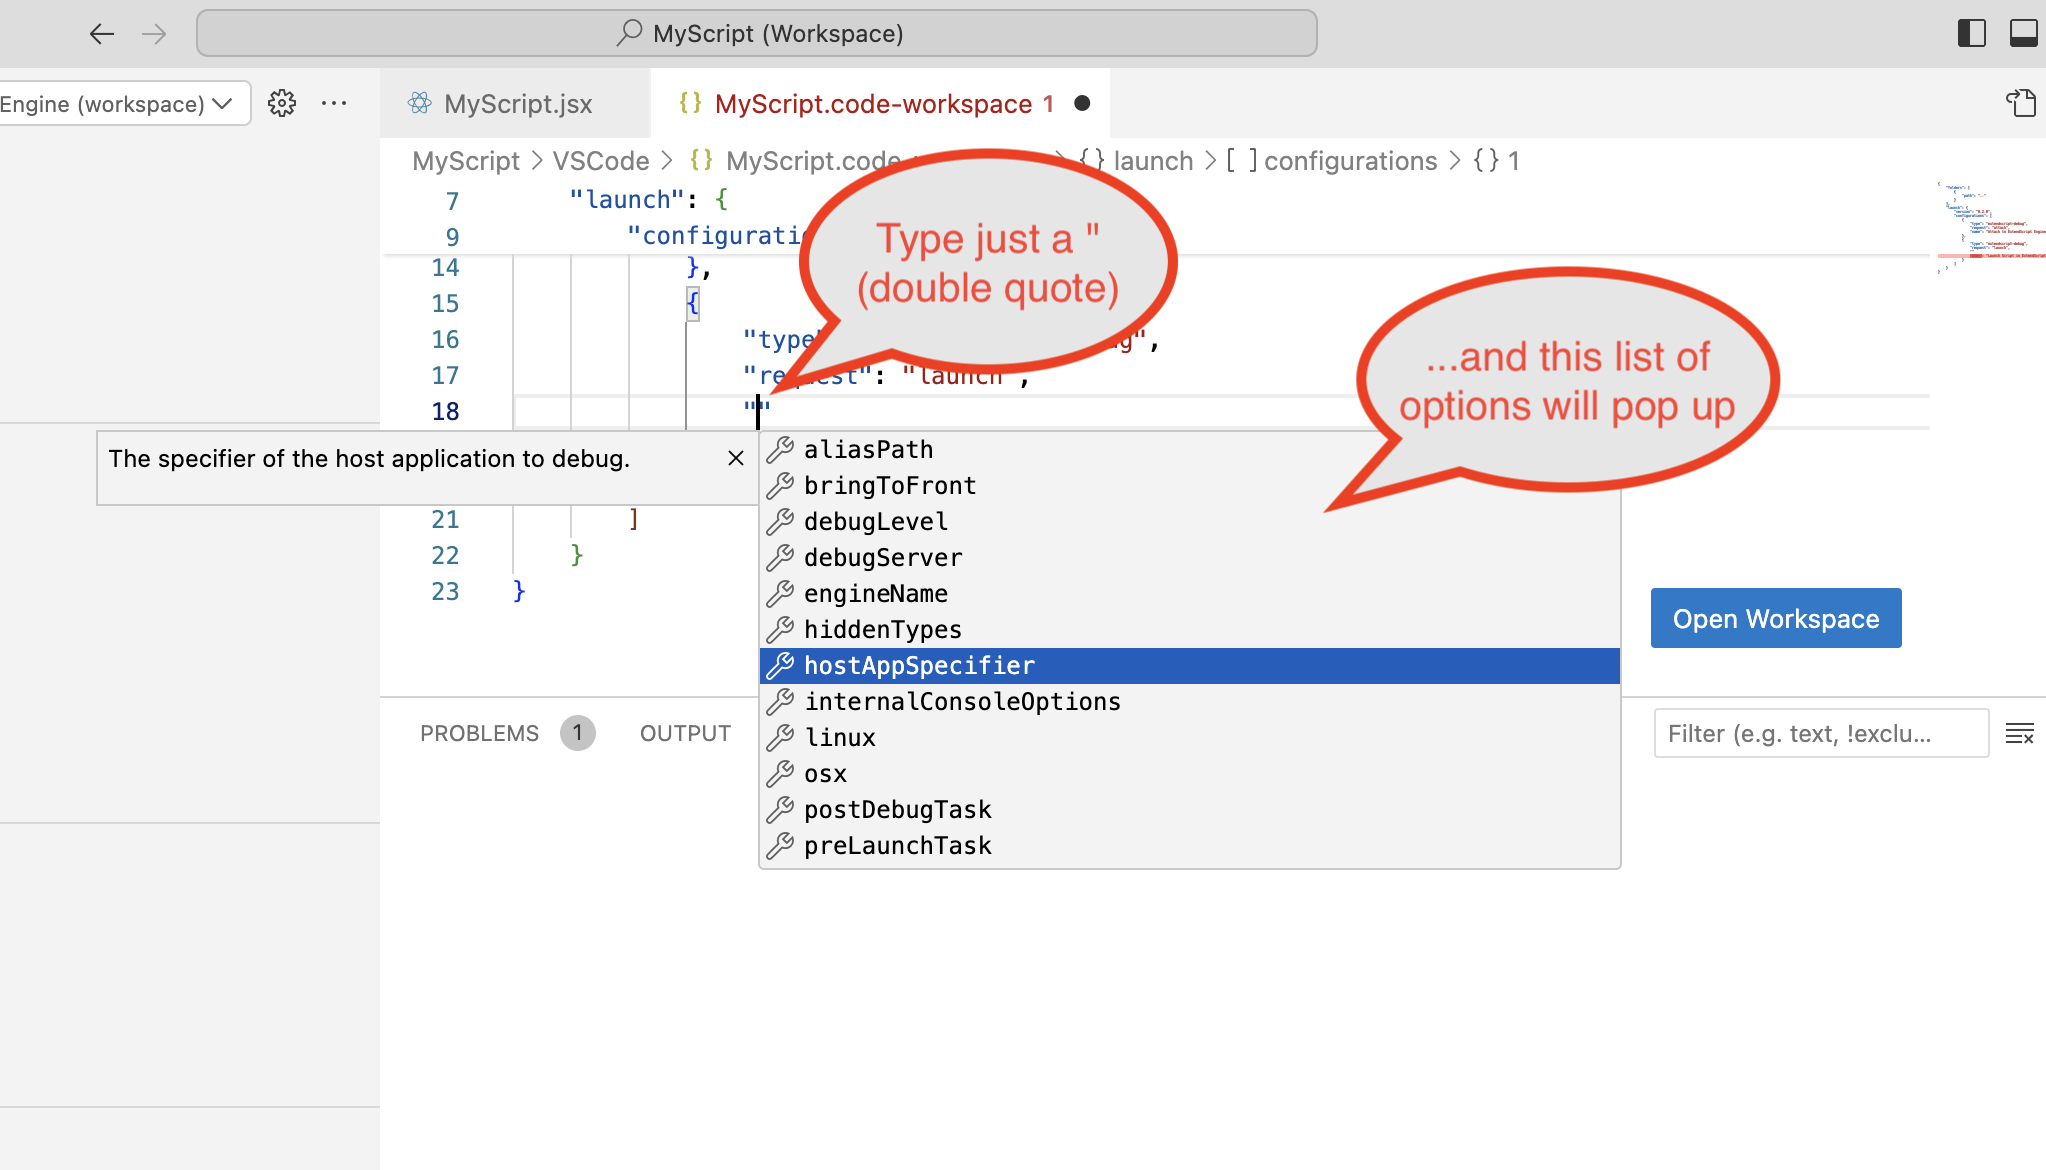
Some of the commonly used options are “hostAppSpecifier” (to pre-determine the Creative Cloud app that needs to run the script) and “engineName” (to pre-determine the InDesign ExtendScript engine name).
If these two options are set, then VSCode will not ask the same questions each time you try to run the script.
Example of a tweaked workspace file:
{
    "folders": [
        {
            "path": ".."
        }
    ],
    "launch": {
        "version": "0.2.0",
        "configurations": [
            {
                "type": "extendscript-debug",
                "request": "launch",
                "hostAppSpecifier": "indesign-19.064",
                "engineName": "main",
                "name": "Launch Script in ExtendScript Engine"
            }
        ]
    }
}
Tips
There is no Object Model Viewer
ESTK has an Object Model Viewer feature, which is handy for exploring the scriptable features of an Adobe Creative Cloud application. VSCode does not offer any replacement for the Object Model Viewer. Instead, try using online resources like
https://www.indesignjs.de/extendscriptAPI/indesign-latest/ https://github.com/docsforadobe
# vs //@
VSCode does not support the ‘old’ ESTK convention of using a pound sign # at the start of special instructions. Instead of using # for meta-info, replace it with //@.
Don’t write:
#include "MyFile.jsx"
#targetengine MyEngine
Instead, write:
//@include "MyFile.jsx"
//@targetengine MyEngine
Visual Studio Code is not Visual Studio
Microsoft has another IDE, confusingly called Visual Studio (without the word Code in the name).
Visual Studio is not the same as Visual Studio Code.
Despite the similar name, the two IDEs are only superficially similar, and things get very confusing when you use the wrong one.
Expect quirks
The ExtendScript Debugger extension is not perfect and has many known quirks, and most of which will never be resolved. This tool is very low on Adobe’s list of priorities, and as scripters, we just have to learn to live with the quirks.
For more info about known quirks, check out the information at the Visual Studio Marketplace where a lot of these issues are explained.
Restarting everything often helps resolve weird issues.
My parting advice is to save often, and when you get into trouble, think of the I.T crowd.
This article was last modified on May 20, 2024
This article was first published on May 20, 2024
Commenting is easier and faster when you're logged in!

Recommended for you

Tip of the Week: Locking Snippets
Sign up for the InDesign tip of the week to get a new tip, roundups of new artic...

Markzware Announces Universal Binary Version for InDesign to QuarkXpress 7
Markzware is pleased to announce its Universal Binary version of InDesign to Qua...

InDesign Downloadable: Tables SuperGuide
A compendium of tips and techniques for terrific tables in InDesign