

In this Presentation Design Conference sneak peek video, Ann K. Emery gives an overview of what she will discuss in her session. From tailoring information to technical vs. non-technical audiences to decluttering how information is displayed to making that information more accessible, you’ll learn how to make your information pop off your slides.
This video is a preview of Ann’s “5 Ways to Improve Your Graphs, Tables, and Maps” session at our upcoming Presentation Design Conference. See the agenda and register now!
Subscribe to the CreativePro YouTube channel for more helpful design tips!
This article was last modified on October 30, 2025
This article was first published on February 7, 2025
Commenting is easier and faster when you're logged in!

Recommended for you
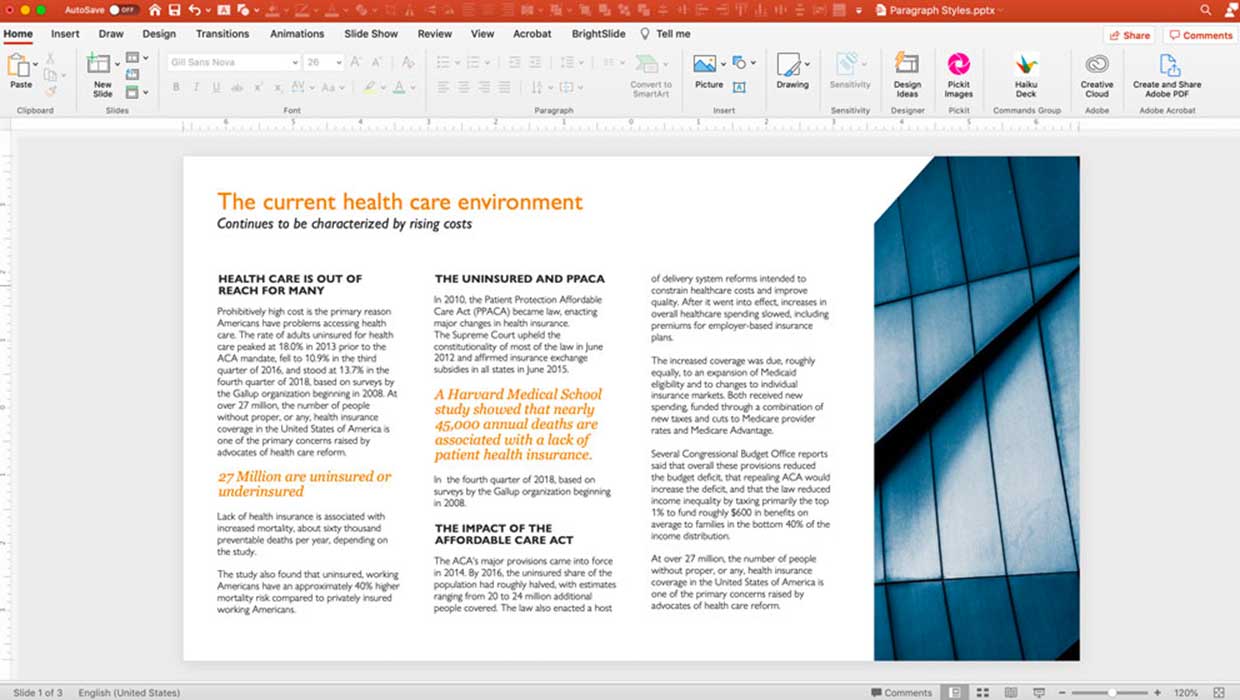
Creating Paragraph Styles in PowerPoint
Learn how to create text styles in PowerPoint that can be applied, edited, and g...
Tips for Creating Better Tables in PowerPoint
Making tabular data in PowerPoint look good can be challenging, but Stephy Hogan...