
How to Make Accessible Tables
Make tabular data accessible using InDesign, Word, PowerPoint, or Excel


This article appears in Issue 16 of CreativePro Magazine.
When it comes to making an accessible PDF, many people dread having to deal with tables. But we assure you it can be done! In this article, we will cover the concepts you need to know and the best practices you should follow to make any table accessible, whether it’s in InDesign, Word, PowerPoint, or Excel.
Before diving into the requirements for an accessible table and how to meet them, let’s consider some of the challenges and guiding principles
Why Are Tables So Hard?
In our experience, there are three main reasons why people dread the task of making tables accessible: poor design habits, misunderstandings about table structure, and a lack of familiarity with screen readers. Each one brings its own inherent challenges.
Poor table design habits
When working with a table, many designers focus purely on the table’s appearance and size. They just want it to look good and fit in a given area on the page, without a thought about how the data will be read by assistive technology. This leads to poor design practices, including hacks like the use of blank columns to space out content and merged rows separating blocks of content into sub-groups. But what isn’t visible on the printed page can (and often does) affect accessibility.
Lack of table structure understanding
We hear it all the time, “It’s impossible to make this table accessible!” When someone says they can’t make a table accessible, what it really means is that they don’t have a clear understanding of the relationship between the table’s structure, data, and scope (a concept we’ll cover in detail). Fortunately, there are tools we can use to remove the confusion and reveal the problems with our tables. Once we have a clear picture of what is happening, we can always take steps to correct it. In all our years in the business, we have yet to meet a table that we could not make accessible!
Screen reader knowledge
Most designers have no experience with screen readers or other assistive technology. But knowing how screen readers navigate a table and present its data is essential when designing (or correcting) a table for accessibility.
The Structure of an Accessible Table
A well-formed table starts with understanding its components. You also need to be familiar with the tagging structure of a regular table. Let’s take a look into the structural elements that make up an accessible table.
Table tags
Tags define the structure of a table. The <Table> tag is the parent tag and all other tags are nested inside it. A table can be divided into regions for the header, body, and footer, but that’s not mandatory.
Columns and rows
At its core, a table is a grid of cells in columns and rows. Columns run vertically and rows run horizontally (Figure 1). An accessible table has the same number of columns in each row. Typically, this is not an issue in a table with no merged cells. However, when you create a table with merged cells, the span value of each cell must be correct to equal the same number of cells the other rows have (see “Irregular Tables” below for more info).

Figure 1. A simple table showing the column and row directions
THead, TBody, TFoot
Within a table there are three core components: the Table Head (THead), the Table Body (TBody), and the Table Footer (TFoot). Each of these areas has a role to play in the organization of the table content, and each should occur only once within a table. A table that spans multiple pages in InDesign often exports to PDF with multiple THead and TBody tags. This redundant table structure will fail accessibility checkers and standards, such as PAC 2021 and WCAG. To fix the problem, you would need to fix the structure so there was only one THead and one TBody tag (Figure 2).
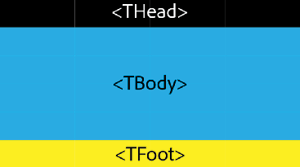
Figure 2. The tags for defining the three main components of table structure: THead, TBody, and TFoot
Column and row headers
Column headers are the labels in the top row(s) of a table. They assign a common label to the items in each column, such as Time, Location, or Date (Figure 3). The first rule most people break is leaving the first cell (A1 in Excel) blank. WCAG requires that all column headers have a value. So, if your design requirements won’t allow you to put a visible label there, you’ll need to fake the look of an empty cell, by assigning the label text the same fill color as the enclosing cell. It works, but it’s not ideal. Leaving empty header cells is just bad table design since it leaves some of the data unlabeled.

Figure 3. Table showing typical stacked column headers to label content
The second most common mistake people make when designing tables is to place additional column headers in the middle of their table to separate groups of content. This might make sense visually, but the screen readers won’t know when to stop reading the header for one section and start reading the header for the next. The result is all the headers up to that point will be stacked and in a row before any of the cell content. For example, you might hear, “North, South, East, West, January, $15 Million,” when it should be, “West, January, $15 Million.”
Scope
When assistive technology (AT) processes a table, it needs to know how to identify each column and row. Scope is the term that tells AT which column or row a header cell points to. Child cells and parent cells are terms used to describe the hierarchy. So, if the scope is column, the AT knows that the cells below the column header are its children. When the scope is row, AT knows that the cells to the right of the row header are its children. Also, scope gives AT cues to voice those parent cells when a user moves from column to column or row to row. Without the scope, AT would only voice the data in the cell it is reading, without identifying the parent column or row. You can imagine how that would make it virtually impossible to understand the table’s contents.
Cell IDs
In an accessible table, every cell has a position, which is labeled with the cell’s column letter, row number, and other identifying information. Columns are typically labeled C1, C2, C3, and rows are typically R1, R2, R3. In a PDF table, cells have no IDs initially. To fix this, you must use the Automatically Generate Cell IDs feature in Acrobat, or label them all manually (Figure 4).
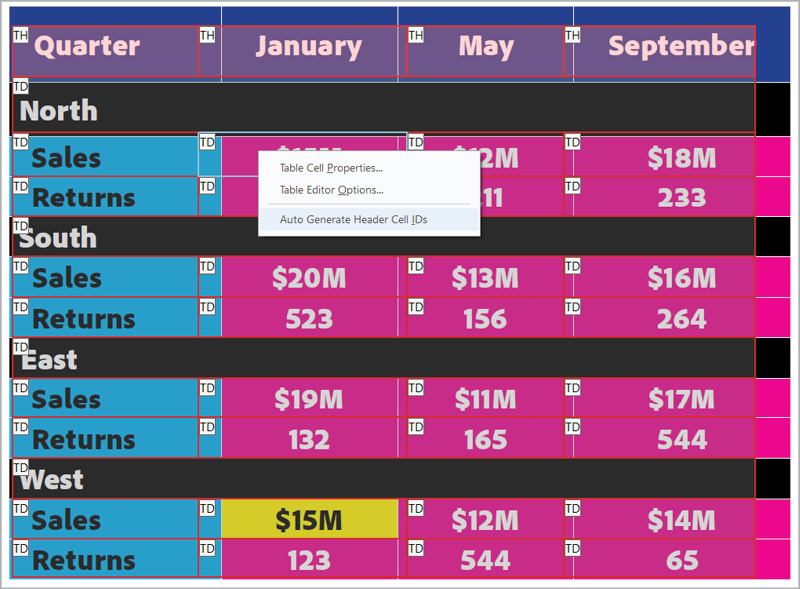
Figure 4. Cell IDs can be automatically generated in the Acrobat Table Editor.
A typical cell ID could be R12C1_Sales, which means it contains sales data in row 12, column 1 (Figure 5). This is especially important for column and row headers in complex tables where you need to set very specific and clear row and column associations.
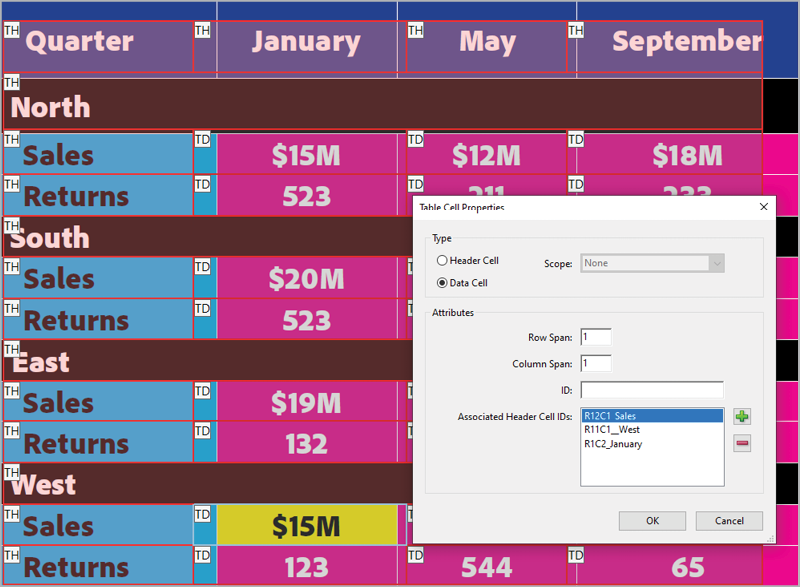
Figure 5. Cell IDs are needed to tell assistive technology which headings to read along with the cell data.
Irregular Tables
Irregular table is an error we get when we run most accessibility checkers like the Adobe Acrobat Accessibility Checker, PAC 2021, axesPDF, or CommonLook (which is being rebranded as Allyant). This error appears when the number of cells in each column or row are not all the same. A regular table has the same number of rows in each column or columns in each row. In other words, the table makes a complete rectangle. There are several tools you can use to inspect table structure. The tools we use most often are the PAC 2021 Screen Reader Preview tool and the free tool Callus PDFgoHTML. We have found it to be the best tool for inspecting tables for irregularity because the color scheme and representation of the layout is the easiest to interpret.
Creating Accessible Tables
Now, let’s examine some of the nitty gritty details of making accessible tables in InDesign, Word, PowerPoint, and Excel.
InDesign
When it comes to accessible tables, InDesign does some things well and others poorly, or not at all. A few best practices go a long way. Avoiding blank header cells (as described earlier in this article), and making sure your tables use text instead of symbols to convey meaning will put you ahead of most designers. So will defining your headers. Unfortunately, InDesign only allows you to define column headers, not row headers. If a row header is needed, you’ll have to define it in another program like Acrobat, CommonLook PDF, or axesPDF after you export the document to PDF. To create a column header in InDesign, just select the appropriate row and choose Table > Convert Rows > To Header (Figure 6). When the document is exported to PDF, the first table row will contain <TH> (i.e., Table Header) cells. However, even if you do this, the table will still fail an accessibility check because InDesign doesn’t set the scope property of the cells to column. This is another task you’ll need to complete in the PDF file to comply with accessibility standards.
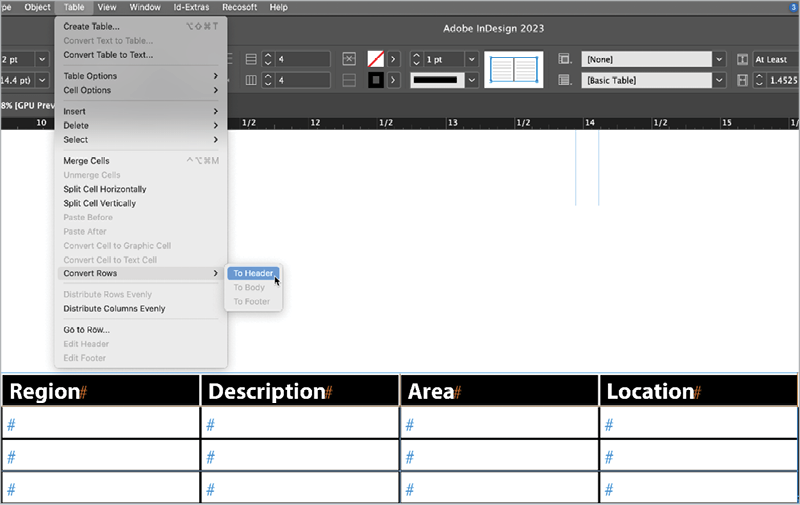
Figure 6. Converting a selected table row to a header in InDesign
The same goes for removing the <P> tag that is the parent tag of every table exported from InDesign. This is a consequence of fact that a table in InDesign is always located within a paragraph in a text frame. The <P> tag is not allowed for PDF U/A compliance, so you will need to delete it in the PDF.
One bit of good news is that InDesign handles merged cells perfectly. The program automatically defines the appropriate ColSpan or RowSpan attribute to make those merged cells compliant in the exported PDF file.
The MadeToTag plug-in by Axaio Software can help you overcome the limitations of working with tables in InDesign. It essentially adds a powerful table editor to InDesign that allows you to define column headers, row headers, and the appropriate scope values. MadeToTag also strips out the parent <P> tag that InDesign wraps tables in by default. You even have the ability to define complex tables with sub-rows that act as sub-headings for data. MadeToTag can save you hours of work when you need to make an accessible PDF from InDesign. You can read a review of MadeToTag in Issue #11 of CreativePro Magazine.
Word
Like InDesign, Word is a mixed bag when it comes to accessible tables. You’ll almost always have to work in the exported PDF to make your tables accessible. The best advice is to keep your table designs as simple as possible when working in Word, so there’s less to deal with later on.
The first thing to watch out for is headers. When you insert a new table into a Word document, the top row and first (left) column are automatically tagged as headers. This can be a problem because in many tables you don’t want the first column defined as a header. To control which part of a table will be defined as a header, click within the table, then click the Table Design tab at the top of the Word interface. At the far left of the Word Ribbon, you’ll see two checkboxes. Header Row and First Column Figure 7. You can use these options to enable or disable the header for the selected table.

Figure 7. Enabling header cells in Microsoft Word
One limitation of this method of defining header cells is that you can make only one row or one column a header. Many times, more than one row needs to be defined as a header at the top of a table. In this situation, you can use a different approach by selecting the rows that you want to become a header, then right-clicking and choosing Table Properties. In the Table Properties dialog box, click the Row tab and click the Repeat as Header Row at the Top of Each Page checkbox (Figure 8). This achieves the desired result, but just be aware that the header will be repeated at the top of each page if the table extends across more than one page. If you don’t want this in your Word document, you’ll need to define the header rows in the PDF.
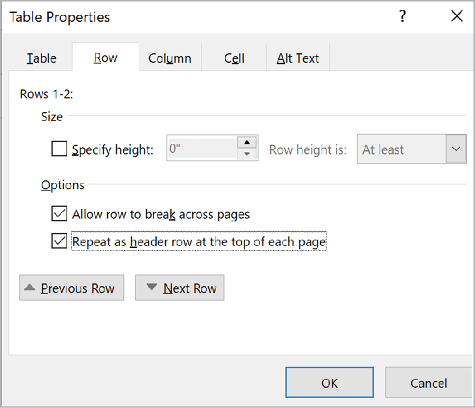
Figure 8. Specifying more than one row as a header in the Table Properties dialog box
Setting the scope property of header cells and applying the appropriate ColSpan or RowSpan property to any merged cells are also tasks that can only be accomplished in the PDF.
PowerPoint
Being a Microsoft product, PowerPoint’s approach to tables is very similar to Word’s, with some key differences. Unlike Word, PowerPoint defines only the top row as a header by default (which is often a good thing). If you click the Table Design tab in the Ribbon, you’ll see the Header Row and First Column checkboxes, just like in Word. PowerPoint, however, formats the headers in a unique way based on the table style that is applied to the table. Enabling either the Header Row or First Column checkboxes will color code that area of the table making it appear as a header visually (Figure 9).

Figure 9. Enabling the Header Row or First Column checkboxes defines the header row in the exported PDF but also formats the table visually based on the table style applied to the table.
PowerPoint suffers from the same limitations that Word does. Header cells will not contain the appropriate scope property and merged cells will lack the ColSpan or RowSpan properties required to make the table compliant. In addition, PowerPoint offers no mechanism to define more than one row as a header. As with Word, our advice for PowerPoint is to keep tables as simple as possible and know that you’ll have some additional tweaking do to in the PDF to meet standards compliance.
Excel
Same as with Word and PowerPoint, you’ll get the best results when you keep the content in your Excel tables as simple as possible and expect that there will always be additional work needed to be completed in the PDF document.
We like to begin by hiding cells that are not relevant to the data in the table. This step isn’t required, but we recommend it because otherwise you may find yourself lost in a labyrinth of cells that go on forever. Start by selecting the first empty column in the spreadsheet, then press Ctrl+Shift+Right Arrow (Windows) or Command+Shift+Right Arrow (macOS). This selects all the cells in the row, beginning with the selected column. Choose Format > Column > Hide. Then, select the first empty row of your spreadsheet and press Ctrl+Shift+Down Arrow/Command+Shift+Down Arrow. Choose Format > Row > Hide. Now, only the cells containing data are visible, which makes them much easier to work with.
To define a row as a header, select the entire table and choose Insert > Table. This command seems redundant, but it redefines where the data of your table is located. The cell range will automatically be populated, but you’ll notice a checkbox at the bottom of the Create Table dialog box called My Table Has Headers. Enabling this checkbox and clicking OK designates the top row of the table as a header row. This provides some unique functionality in Excel, but more importantly for our purposes, the cells of the top row will be tagged with <TH> tags when you export to PDF.
One of the biggest challenges when creating accessible PDFs from Excel is simply fitting the table to the desired page size during export. Use the Print command, then play with the page setup, paper size, and orientation settings until you get it looking right. Then, instead of printing to a printer, click the PDF button to export to PDF.
In addition, you should expect a certain amount of cleanup after exporting the PDF. For example, row headers will need to be set in the PDF. We’ve also encountered situations where empty data cells are not exported properly in the PDF, which can result in a regularity error when the PDF is checked for compliance. But in general, the table structure should match its visual appearance in Excel.
One last word of advice is to keep Excel (and your other Office applications) up to date. Run the Office updater regularly, because Microsoft is constantly making improvements for accessibility, and you don’t want to be left out when they do.
Turning the Tables Towards Accessibility
We hope the things you’ve learned in this article make the idea of creating accessible tables a lot less daunting. While the exact techniques differ from program to program, the same concepts and standards always apply. You can avoid a lot of trouble in Office programs by sticking to simple table designs. And if you’re using InDesign, design your tables with accessibility (not just visual appearance) in mind, and check out the MadetoTag plug-in.
Commenting is easier and faster when you're logged in!

Recommended for you
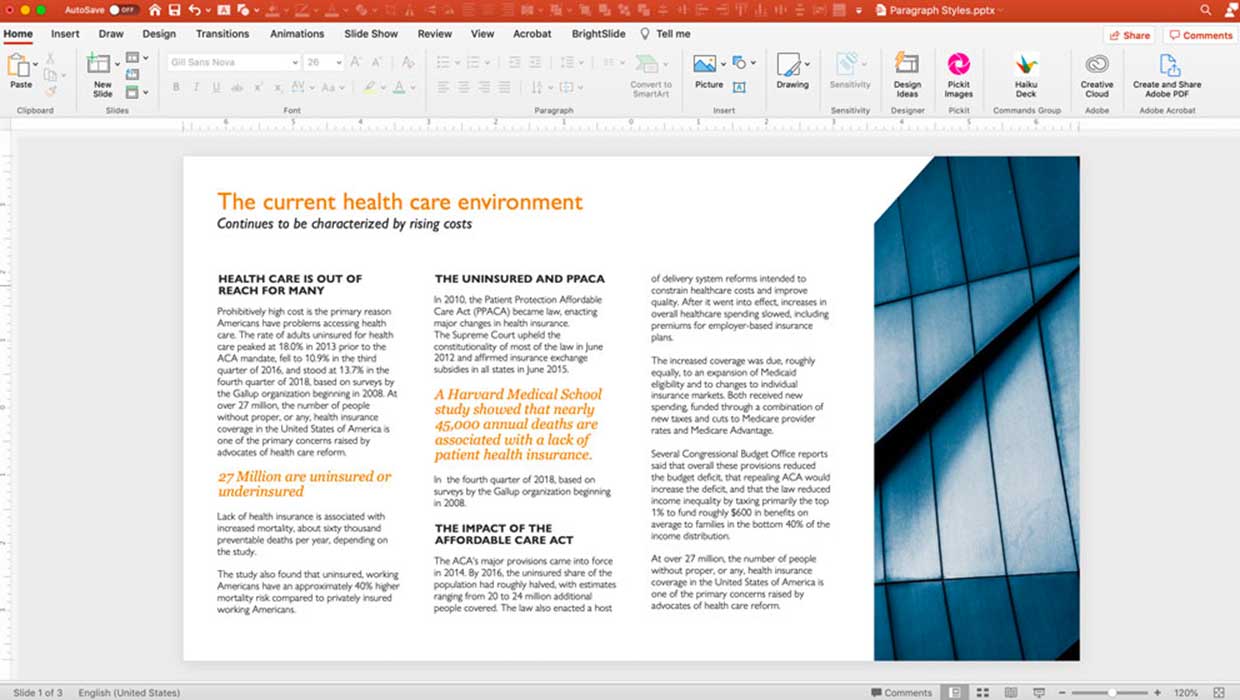
Creating Paragraph Styles in PowerPoint
Learn how to create text styles in PowerPoint that can be applied, edited, and g...
How to Create Morph Transition FX in PowerPoint
Learn how to create dynamic transitions between slides or individual objects in...
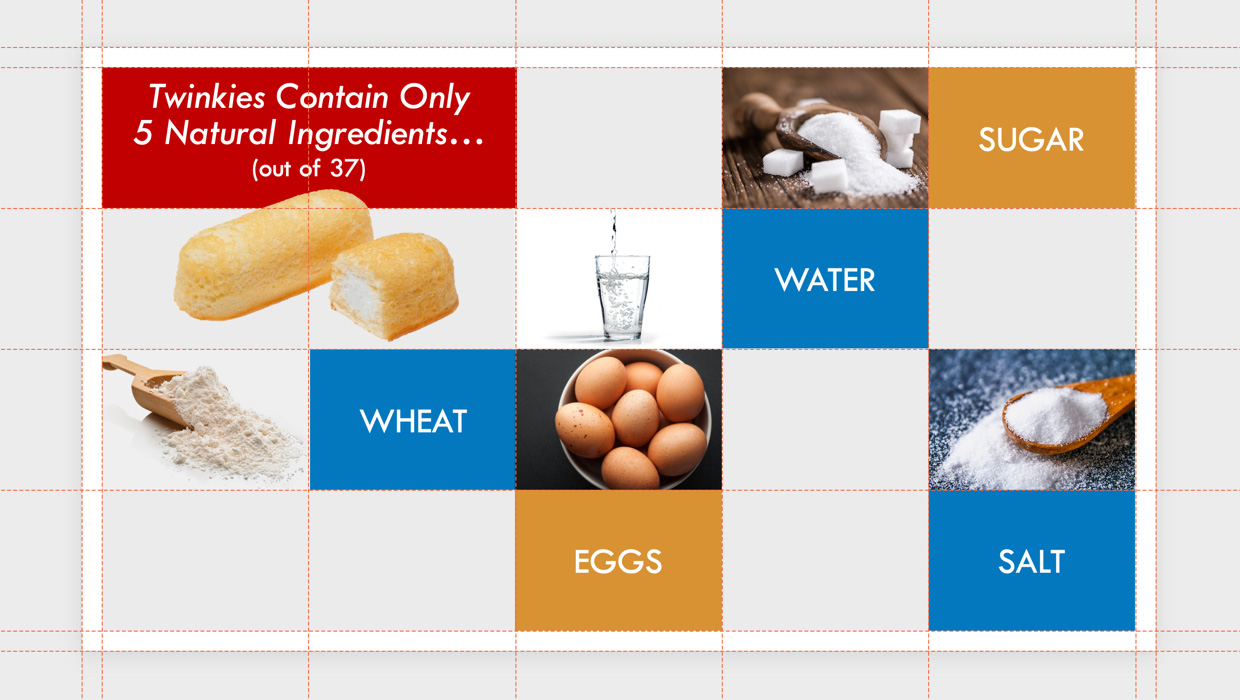
Setting Up a Design Grid in PowerPoint
How to use of a grid system in PowerPoint to add consistency and visual structur...