
It has been possible to create pie charts in Illustrator since version 5 appeared in 1993. But apart from a brief (and then canceled) foray into online graphing, the tool has not been significantly updated in the intervening 29 years. One of the chief gripes from users was the inability to create 3D pie charts; but it is possible, with live graph data, as we’ll see here.
1: Create your chart
Choose the Pie Chart option from the Graph tool in the Toolbar, and sketch out its size. You don’t need to draw a perfect square: the chart will be exactly circular. Enter the values in the Data panel that appears, and click the checkmark icon to apply the data to the chart.

2: Change your colors
The pie chart will appear in shades of gray. To change the colors, click inside each segment with the Direct Selection Tool (shortcut: A) and then pick the new color for that segment from the Swatches or Color panels.

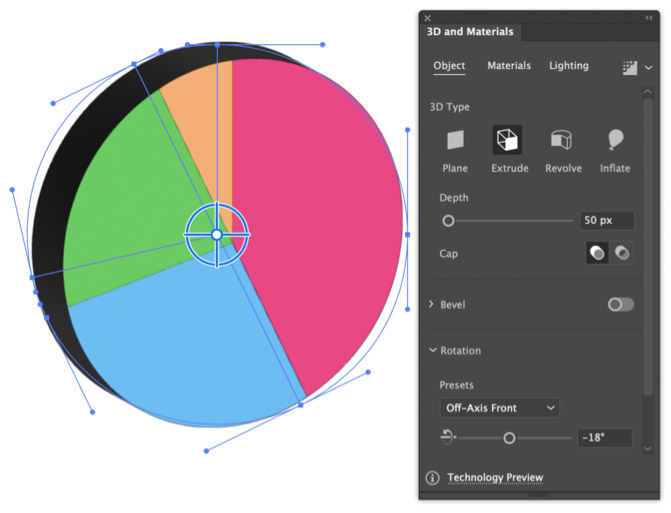
3: Make it 3D
If you have the latest version of Illustrator CC, there’s a simple way to make this chart 3D (if you have an earlier version, jump to step 11 below). Choose Effect > 3D and Materials > Extrude & Bevel, and you’ll see the artwork extruded into 3D as seen here.
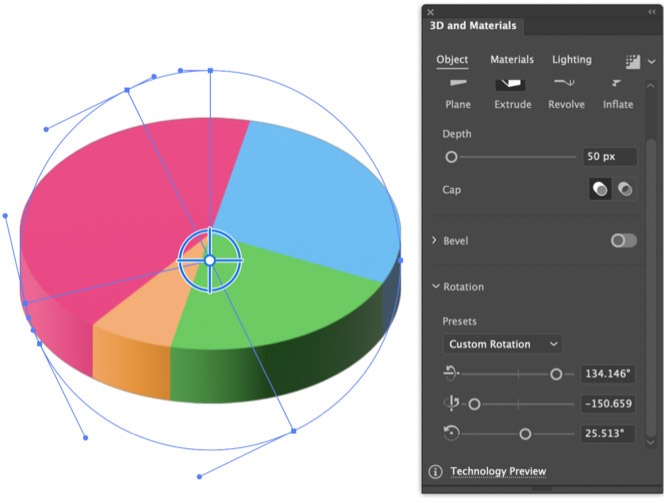
4: Rotate the view
You can use the control in the middle of the artwork to rotate and tilt the 3D object. For more precise control, use the sliders in the Rotation section of the 3D and Materials panel.

At this point you might be wondering why the extruded sides of the pie chart are black, rather than picking up the colors of the segments. The answer is simple: when Illustrator creates a pie chart, it adds a black stroke to it, and it’s the stroke color that is used for the extrusion. Select the chart and remove the stroke for an instant improvement.
5: Pull out a segment
If you want to highlight a particular segment of a pie chart, pull it out. Here, you might want to pull out the orange wedge. But when you hover over it, a much larger segment is highlighted.

You might wonder at first, why Illustrator is showing you the wrong segment. The reason is when the pie chart was originally created, that segment was at the top (see step 2). Although the 3D view was rotated, the underlying artwork remains the same. You need to pick the segment from its original location.

Once you locate the correct segment, pull it away and the corresponding wedge will move in the 3D model. The whole model will in fact jiggle around a little as you pull, while Illustrator rebuilds it.

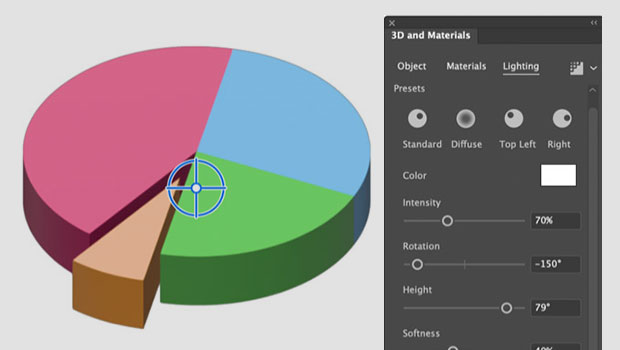
6: Adjust the lighting
In the previous image, the yellow segment cast a shadow over the green wedge next to it. If you don’t want this to happen, go to the Lighting tab in the 3D and Materials panel, and adjust the Rotation and height. If you use Command+H (Mac)/Ctrl+H (Windows) to hide the paths first, you’ll get a clearer view of the artwork.

7: Update the data as necessary
Even though the pie chart has been extruded, and a wedge pulled out, it’s still linked to live data. Right-click on it to get the contextual menu, and choose Data. You’ll now be able to change any of the values, and the chart will instantly update. You might want to reposition any pulled-out wedges at this point.

The Alternative Approach
Illustrator still retains its “legacy” 3D tools, and there are good reasons to consider using them. If you have an older version of Illustrator then you have no choice. But it’s also worth remembering that while the new 3D engine in Illustrator produces a bitmap image, the original 3D tools still create proper resolution-independent artwork. To use this method, choose Effect > 3D and Materials > 3D (Classic) > Extrude & Bevel (Classic).

You can use the virtual cube to orient the 3D object, or use the three axis wheels. In some ways, operations such as tilting and rotating the pie are easier with this method. You’ll probably also want to adjust the lighting, and to change the default 25 blend steps to a higher value to avoid ugly banding on the sides.

Making a Tasty Donut Chart
Regular pie charts have started to look somewhat dated, but knock a hole in the middle and you’ve got a donut chart, which has more freshness (and more sugar).
1: Ungroup
To create this effect you’ll first need to turn your pie chart into regular Illustrator artwork by choosing Object > Ungroup. You’ll see this warning that the graph will be unlinked from its data, so make sure the data are correct before proceeding.

2: Knock out the middle
Draw a circle with the Ellipse tool, centered on the pie chart, and Copy it. Select the circle together with one of the segments, open the Pathfinder panel (Window > Pathfinder, if it isn’t already open) and click the Minus Front button. This operation only works with one segment at a time, so you’ll need to Paste the circle, select another wedge and repeat for each of the segments.

3: Make it 3D
You can turn the donut chart into 3D using either of the methods above. This version uses the newer technique. I’ve also adjusted the lighting to a low angle for a more dramatic appearance, and viewed it from a slightly jaunty angle.

4: For bonus points, add a bevel
You can use the Bevel controls in the new 3D panel to add this effect, which makes a more noticeable join between the different segments. Now that’s a more interesting 3D chart!

Commenting is easier and faster when you're logged in!

Recommended for you

CreativePro Conference Speaker Spotlight: Michael Ninness, Designer, Dad & Beachcomber.
Welcome to our new series of posts called Speaker Spotlight, designed to highlig...

Review: Datylon Graph for Adobe Illustrator
The most advanced graphing tool available inside Illustrator CC What tools do yo...
InReview: PixelSquid
PixelSquid is a service that takes stock art to a new level, offering a vast lib...