

The histogram—the graph of tonal levels you see in photo-editing software—helps you evaluate the tone and color characteristics of an image. But when you think about the reasons why we’re taught to use the histogram, it turns out that newer tools are better at showing you the tonal problems you’ll most want to solve. You find these tools in Adobe Photoshop, Adobe Camera Raw, and Adobe Photoshop Lightroom, and because of them I use the histogram much less than I used to.
Why We Learn the Histogram
In photo-editing software, a histogram shows you the distribution of tonal levels in an image or its individual color channels (such as the red channel in an RGB image). At a glance, you can see the proportions of shadows, midtones, and highlights in an image, from black at the left end to white on the right end. Taller parts of the histogram tell you that more pixels in the image use those tones, and low or flat areas of the histogram tell you that there aren’t a lot of those tones in the image. Red, green, and blue colors tell you which RGB channels contain pixels at a given level; other colors indicate pixels from more than one channel at that level (for example, yellow means you’re seeing pixels from both red and green channels).

An image and its histogram. This one’s from Adobe Photoshop CS6.
The most useful parts of the histogram are the left and right ends. If the left or right end is flat, your image isn’t using the full range of tones available and may need more contrast. If the tones at the left or right end look pinned to the top of the histogram, your image may have blocked shadows or clipped highlights that you may want to correct.

The image represented by this histogram may be overexposed because deep shadow tones are missing, and the highlights appear clipped to white.
Where the Histogram Falls Short
The information the histogram shows is useful, but incomplete. You can’t tell if an image looks good or bad based on the histogram alone, because a histogram that looks technically undesirable might actually be appropriate depending on the image content and your photographic intention. For example, while a histogram with tones primarily on the left side of the graph indicates that the image is very dark and midtones and highlights are rare, if it’s for an image of a nighttime scene then the histogram is completely appropriate. Similarly, while a histogram can show you signs of possible shadow or highlight clipping, the histogram can’t tell you where in the image it’s happening, or if it’s bad enough for you to take action.

This histogram (top) indicates its scene may be underexposed, but the actual photo (bottom) is OK because it’s a light painting at night.
If the histogram is helpful but inconclusive, how can you get the rest of the information you need to understand whether you’ve correctly edited an image’s tonal range? It turns out that various useful tools have been added to photo-editing software over the years, and they give you the useful insights that you won’t get from the histogram.
Find Clipping Faster with Overlays
In photographs, you want to avoid clipping shadows and highlights because when shadows go completely black or highlights become totally white, you’ve lost image detail in those areas. Properly setting a black point for your shadows and white point for highlights keeps important details inside the tonal range of the final image. The histogram can’t show you where in an image clipping is happening, but clipping previews can.
You’ll find clipping previews in Photoshop, Camera Raw, and Lightroom. I’ll talk about Lightroom first. In the Develop module, press the J key to toggle the clipping overlays that mark clipped tones with color. Clipped shadows appear blue, and clipped highlights appear red. By viewing these, you can judge whether the amount of clipping and their locations are appropriate. For example, if the overlays show you that highlights are clipping only in the sun or on specular highlights, where there aren’t any details to lose, there’s no need to correct them. You can also toggle the clipping overlay by mousing over or clicking the box icons at the top left and right corners of the histogram.

Lightroom 4 can display shadow clipping (marked by the blue overlay) and highlight clipping (marked by the red overlay).
Camera Raw works similarly; its histogram has clipping overlay box icons too. The keyboard shortcuts are different, though: Toggle shadow clipping by pressing U (as in underexposed), and highlight clipping by pressing O (overexposed).

Clipping overlays are also available in Camera Raw 7.
To see a clipping preview in Photoshop, Option-drag (Mac) or Alt-drag (Windows) the black slider (shadows) or white slider (highlights) at the bottom of the Curves or Levels panels or dialog boxes. You can also Option-drag/Alt-drag the tone sliders in Camera Raw and Lightroom. When colored pixels appear in the clipping preview, it’s telling you that an RGB channel is clipping, as in the histogram. Black means all channels are clipping.

Option-drag/Alt-drag a white Curves slider to show highlight clipping in Photoshop CS6.
The clipping previews are much more useful than the histogram for keeping the extremes of the tonal range under control. But what about the midtones? That’s a harder question. Because the middle of the histogram can take any shape depending on the content of an image, the histogram isn’t much help with evaluating midtones; you have to rely on how they look on the monitor…if your monitor can be trusted. To make sure you’re getting accurate visual feedback, use a hardware-based calibrator to create a monitor profile. The calibrator software should automatically set up the profile in OS X or Windows. Good photo software such as Photoshop, Camera Raw, and Lightroom will automatically use the monitor profile installed in the system.
Preview Output More Precisely by Soft-Proofing
Looking at a calibrated monitor might be enough if you’re preparing images for on-screen display. But if you’re preparing images for output that’s much different than a monitor, such as ink on paper, you can take accurate tonal display to the next level by soft-proofing. In Photoshop and Lightroom, soft-proofing lets you simulate the limitations of your final output so that you can more clearly visualize the adjustments needed to make an image look its best on a particular medium, such as a specific combination of printer, ink, and paper. Here’s a quick overview of how that works.
In Lightroom, soft-proof in the Develop module by pressing the S key or enabling Soft Proofing in the toolbar. This reveals soft-proofing controls below the histogram including a Profile menu where you can choose a color profile that represents the output you want to simulate. When you turn on soft-proofing the image may appear to lose a lot of contrast and saturation, but don’t be alarmed. It’s simply telling you the truth about the limited range of tones and colors the output can r
eproduce compared to the monitor. By displaying the simulated output as you edit your image’s tones and colors, soft-proofing can reduce the number of surprises you see when you actually do print. And that helps you get to the final print faster.

You can soft-proof the printing conditions in the Develop module in Lightroom.
In Photoshop, soft-proof by choosing View > Proof Setup > Custom. The options are more complex than in Lightroom, but generally you want to choose the profile for your output conditions from the Device to Simulate pop-up menu, choose the Relative Colorimetric rendering intent, and turn on Black Point Compensation. After you click OK, you can toggle soft-proofing by choosing View > Proof Colors. For more detail about the Proof Setup options, read the article “Out of Gamut: Soft Proofing in Photoshop 6.0” by Bruce Fraser; the option names have changed slightly since then but Bruce’s explanations are still valid.

In Photoshop, you set up soft proofing in the Customize Proof Condition dialog box.
Soft-proofing can be valuable in evaluating the near-white and deep shadow tonal ranges that are typically challenging to reproduce in print. Tools such as the very useful Shadows and Highlights sliders in Lightroom 4 and Camera Raw 7 do most of their work in those ranges. Soft-proofing helps ensure that the adjustments you make in those tonal ranges appear as intended in the final print.
Photoshop also includes the View > Gamut Warning command, which is similar to the clipping displays in that it overlays a color to highlight pixels that fall outside the color gamut of the profile you chose in Proof Setup. However, seeing which pixels are out of gamut is less important than seeing how those out-of-gamut pixels actually look. Instead of making corrections on Gamut Warning alone, use it as a signal to turn on soft-proofing and inspect those areas more closely, and then decide whether you need to spend time correcting them.
What You See Depends on How You Set It Up
When you use the clipping display, soft-proofing, or the histogram to evaluate the tone and color qualities of your image, be aware that the visual feedback they show you can change depending on certain settings. After all, something has to define the limits that the software uses to indicate issues such as clipping. Those limits are defined by the color profile used for editing the document; or if you’re soft-proofing, it’s set by the output profile you chose to represent your output conditions. If you change that profile, you’ll notice that the clipping display, soft-proofing, and histogram will probably change too, because various color spaces are different sizes. For example, shadows and highlights clip sooner in sRGB than in ProPhoto RGB.
Camera Raw shows you the color profile it’s using, at the bottom of the Camera Raw window. Click the blue underlined text to choose from four available profiles. This is also the color profile the image uses when you open the image in Photoshop or save directly from Camera Raw.

When you change the document color profile, the clipping points change, as shown here in Camera Raw set to ProPhoto RGB (top) and sRGB (bottom).
Photoshop can tell you the document’s profile at the bottom of the document window if you click the triangle to the right of the status area and choose Document Profile. If you’re soft-proofing, the current output profile appears in the document’s tab or title bar at the top of the window.

In Photoshop it’s easy to see both the output (top) and document (bottom) profiles that affect the clipping overlays and other tonal previews.
Lightroom edits using a color profile related to ProPhoto RGB. It isn’t labeled and you can’t change it, but it’s large enough to encompass just about all types of output. But printed output uses much smaller color spaces, which is why it’s valuable to soft-proof through print profiles to more accurately simulate how your tones and colors will be limited by the intended output.
The tools I’ve discussed give me the visual feedback I want when correcting an image, providing more relevant information than the histogram, letting me make judgments based on the image itself and in the context of final output. These days I usually hide the histogram to free up more space on my monitor. I’m not suggesting that you avoid the histogram completely; it can still be useful for quickly spotting basic exposure problems and habits. But you’ll get better insights into image quality if you use the full range of tonal visualization tools. Evaluate clipping using clipping previews, calibrate your monitor so that you can see the rest of the tones accurately, use soft-proofing when needed, and let your eyes guide you the rest of the way.
This article was last modified on July 20, 2021
This article was first published on March 1, 2013
Commenting is easier and faster when you're logged in!

Recommended for you
Turning an Image to Pure Black and White in Photoshop
Turning images to black and white gives them a stark, urban feel that can look g...
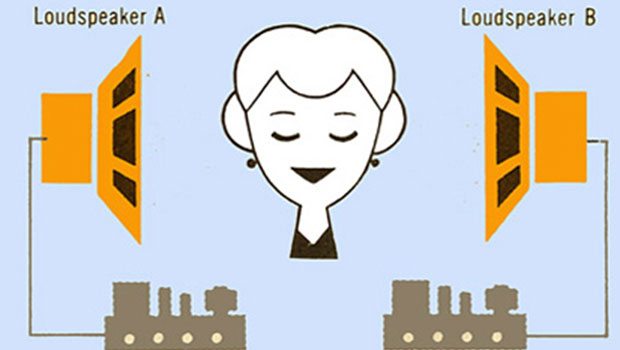
Scanning Around With Gene: Listening to Music with Both Ears
I recently splurged and used ten years’ worth of American Express points o...

Fast Photo Fixes with AI in Photoshop
Learn how to use AI in Photoshop to quickly manipulate an image’s depth of field...