
5 Ways to Get Pie Charts into InDesign
In an analytical world, pie charts can help to serve up your data in a tasty way.


This article appears in Issue 85 of InDesign Magazine.
Everyone likes pie (charts), right? Pie charts are one of the most common methods of visually representing data. Not only are they visually pleasing, but they help readers to easily understand the information in a logical, intuitive way. InDesign doesn’t natively contain a tool you can use to create pie charts directly. That doesn’t mean that you’re out of luck, though. When it comes to creating pie charts in InDesign, I’ve seen a number of different approaches, and I’d like to show you five different ways that you can get pie charts into an InDesign document, each with their own benefits and downfalls depending on your workflow.
1. Create Them in InDesign
Even without a Pie tool we might wish for, you can still build your own pie charts natively in InDesign using the shape tools, the Pathfinder panel, and a little bit of math. Start by drawing a circle in InDesign using the Ellipse tool to the size that you want the pie chart to appear. Copy the circle to the clipboard, as you’ll need it again later. Next, use the Pathfinder panel options to subdivide the circle into the appropriate pieces. I accomplish this by drawing a black square on top of the circle and positioning it in one of the quadrants of the circle, which of course eliminates 25% of the circle. In my example, let’s say the first value that I need is 52%, so I need to eliminate 48% of the entire circle. I’m already down 25% with my original square, so I copy that square to cover up another quadrant of the circle. To determine how to reveal an additional 2% of the circle, I did a little bit of basic math and divided 360 by 100, which gave me 3.6. So 3.6 degrees
of a circle equates to 1% of the circle. Using the Rotate tool, I rotated the second square –7.2° (3.6·2) to reveal the appropriate amount of the circle (Figure 1).
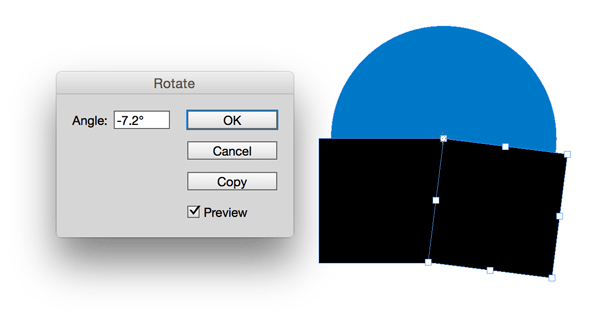
Figure 1: Rotate the square to reveal the appropriate amount of the circle.

Figure 2: The circle, after using the Subtract command.

Figure 3: The final pie chart, created entirely in InDesign.
2. Illustrator’s Graph Tool
Adobe Illustrator has contained a Pie Graph tool since the dawn of time. Well, maybe not quite that long, but you get the idea. Although it has been there for some time, a lot of users overlook this powerful tool. The nice thing about the graph tools in Illustrator is that they automatically generate graphs based on the data that you input. Start by selecting the Pie Graph tool in Illustrator, and click and drag on the artboard to define the size of the pie you want to create. The graph data window immediately displays, so you can enter the values for the chart. Type in the appropriate values to represent the data in the pie chart, and click the Apply button ; Illustrator generates the graph based on the data. If you have data that exists in a text file or Excel sheet, Illustrator allows you to import that data into the Graph Data window (Figure 4) via the Import Data button.

Figure 4: The Graph Data window in Illustrator.

Figure 5: The Illustrator pie chart with legend.
3. The Chartwell Font
Created by Travis Kochel out of a need for a simple way to create graphs within design applications, Chartwell uses OpenType ligatures to render graphs out of text entered using the font. To get started, type numbers to represent the values in your pie chart, and separate those values using the plus sign (+). Apply a color to each value that you want the color to represent (Figure 6).

Figure 6: Type the values separated by a “+” sign.

Figure 7: Pie chart created using the Chartwell Pies font.
4. Microsoft Excel
Most people won’t refute the number- crunching capabilities of Microsoft Excel or its ability to create pie charts and other chart types from that data. Yet as good as Excel’s number-crunching is, its graphics capabilities leave a bit to be desired, which makes it challenging to get an Excel chart into InDesign. Although InDesign can place an Excel spreadsheet as a table, it doesn’t recognize any of the charts within the Excel file. There are primarily two ways to get a chart from Excel into InDesign. First, you can save the Excel chart as a PDF file, which can then be placed into InDesign. However, your control over the conversion of the file to PDF can be limited. Also, Excel works in the RGB world and tends to render black text and lines using RGB color—not ideal for professional print jobs. Another option is to copy the chart from Excel and paste it into Adobe Illustrator (Figure 8).

Figure 8: Pie chart created by copying a chart from Excel into InDesign.
5. The Claquos 2 Script
Claquos 2 is an InDesign JavaScript written for the sole purpose of providing a way to create pie charts directly within Adobe InDesign. Currently, Claquos 2 is in beta and available for free from indiscripts.com. Being that Claquos is an InDesign script, you’ll need to install it in the Scripts panel within Adobe InDesign. For instructions on how to install InDesign scripts, see this InDesignSecrets post. To use Claquos, begin by double-clicking on the ClaquosBeta.jsx script in the Scripts panel to open the Claquos dialog box (Figure 9).
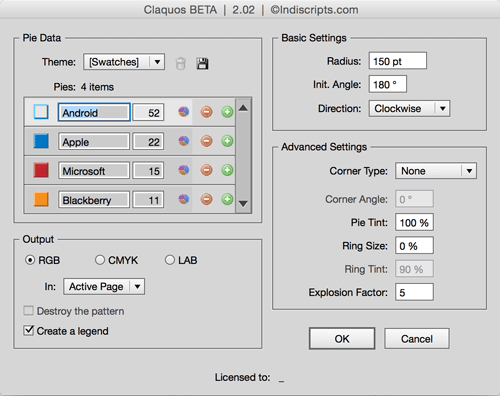
Figure 9: The Claquos 2 dialog box.

Figure 10: The pie chart generated with the Claquos 2 script, including a legend.
Now Get Cooking!
With this wide range of options, each having its own strengths, you’re certain to find a, er, flavor of pie chart to suit your taste (and your workflow).
Commenting is easier and faster when you're logged in!

Recommended for you


Indesign Basics: Numbering Pages
InDesign can number your pages, but a little bit of setup goes a long way, as Er...

InStep: Highlighting Tables
Diane Burns shares a creative technique for drawing attention to important tabul...