
I’ve often wondered if automobile safety today is better or worse than it was back in the days when seat belts were optional, cars where much bigger, and drinking and driving didn’t have the stigma it does now. I always assumed more people died in those days but I didn’t know for sure until writing this week’s installment, which focuses on the artwork contained in a Travelers Insurance Company brochure from 1968.
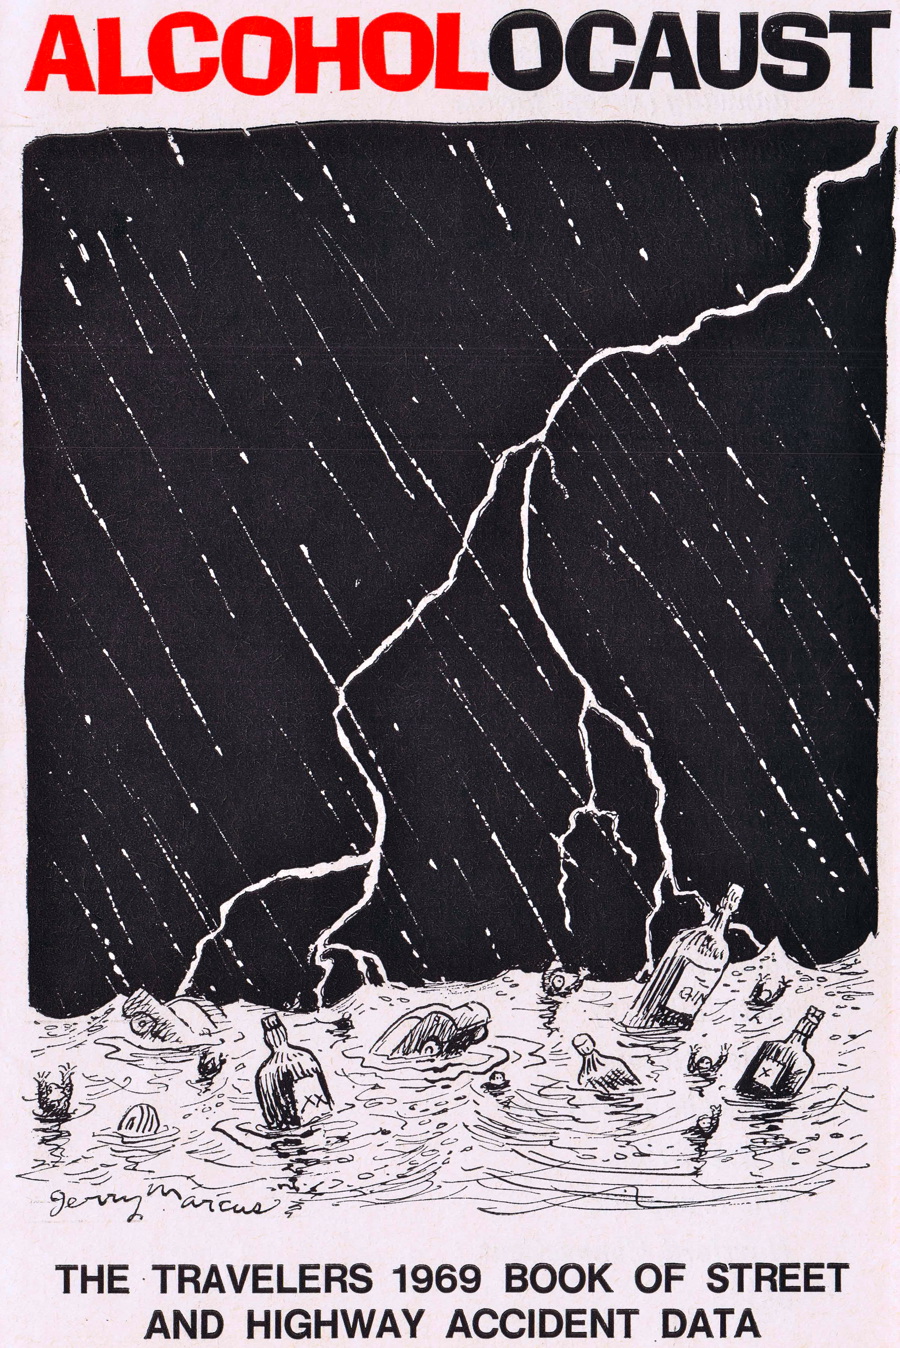
The brochure, called “Alcoholocaust,” presents in a straightforward way the statistics of highway accidents for the years 1967 and 1968. The purpose of the pamphlet was to promote safe driving, the concept being that if people knew what mayhem was actually happening on the road, they’d be more cautious. Click on any image for a larger version.
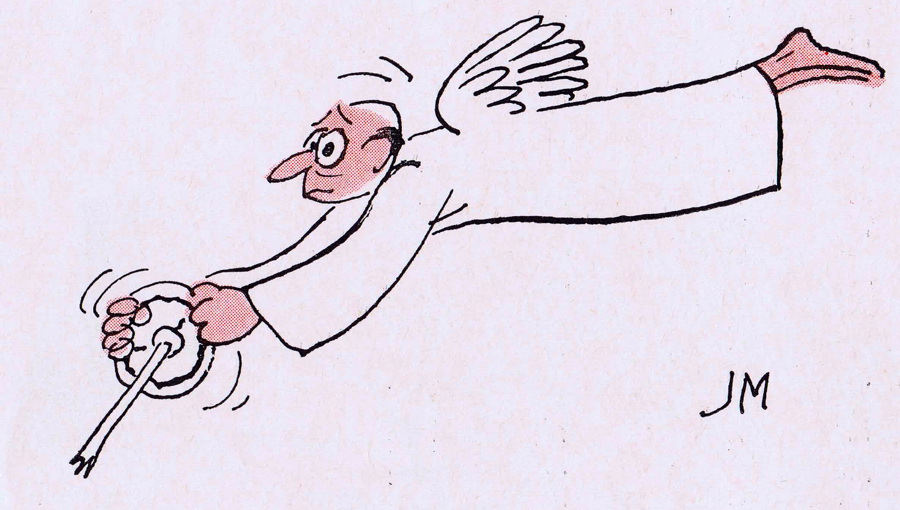
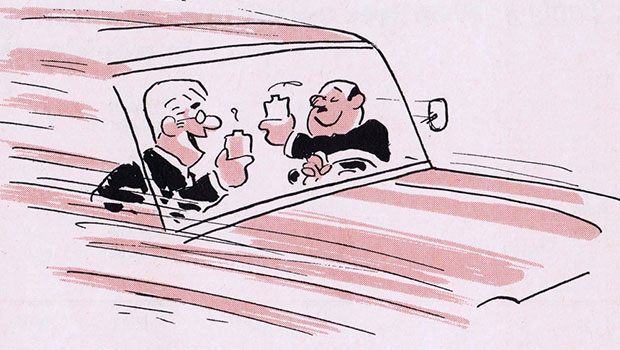
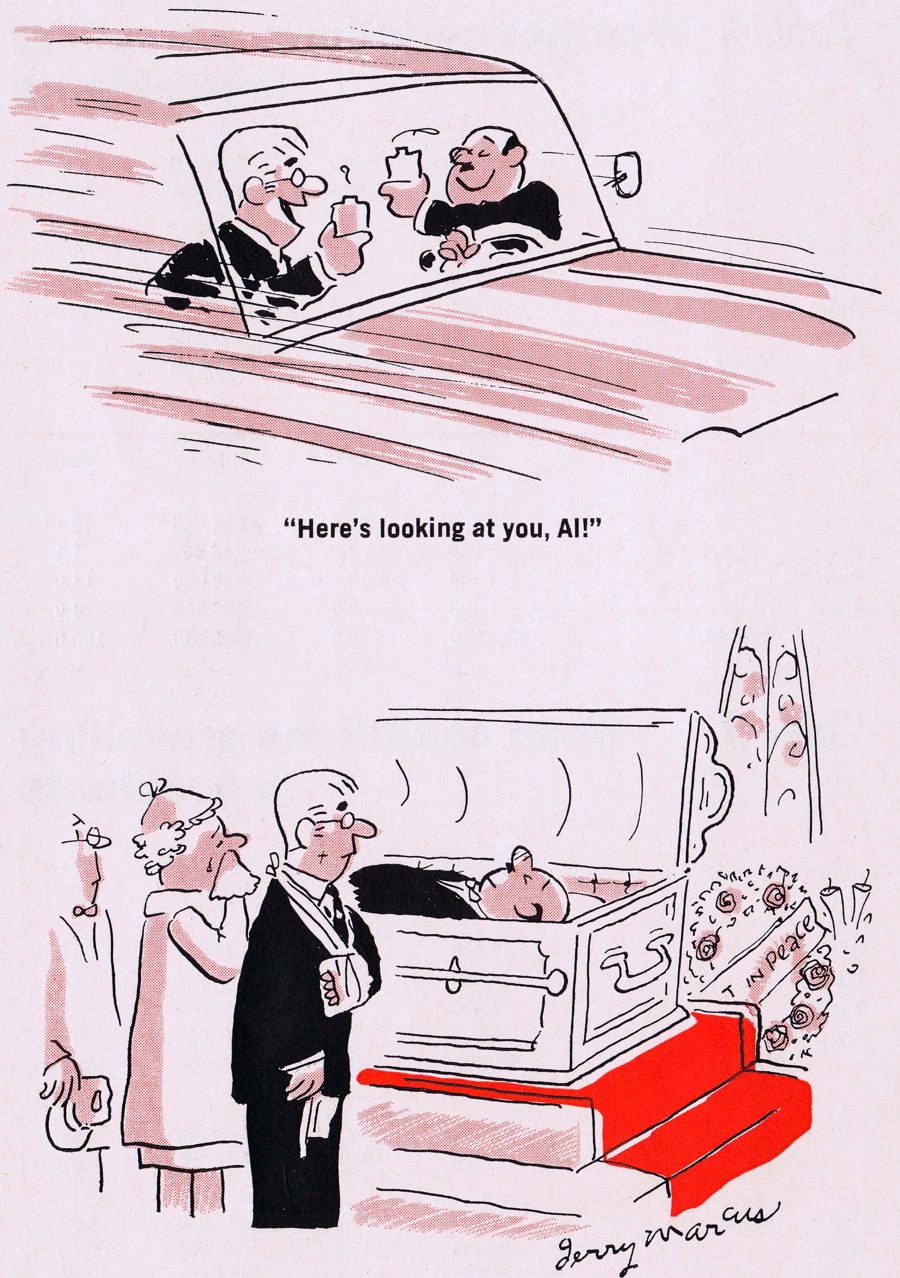
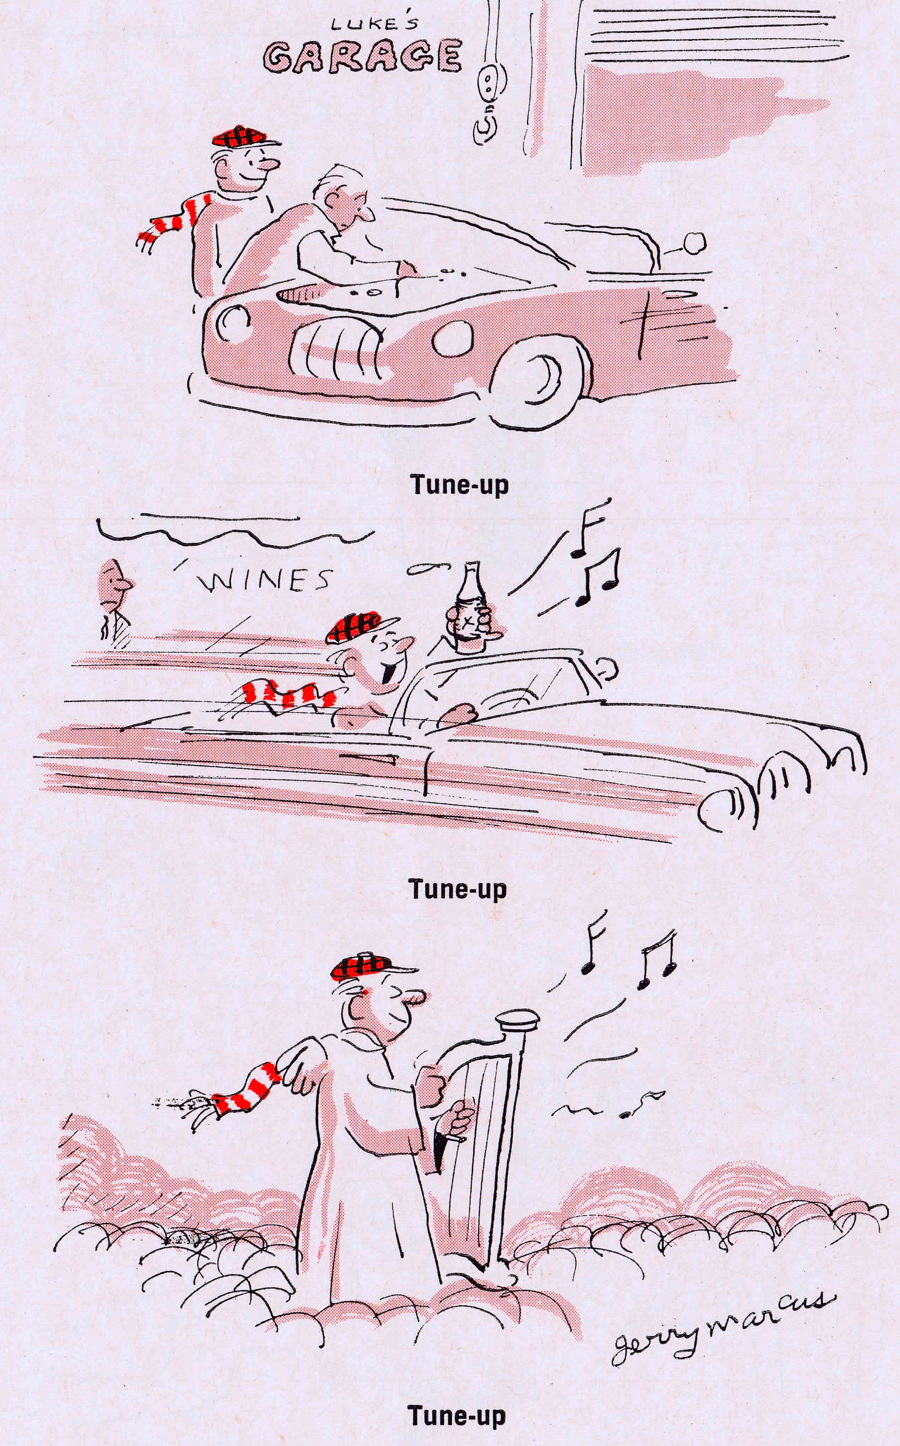
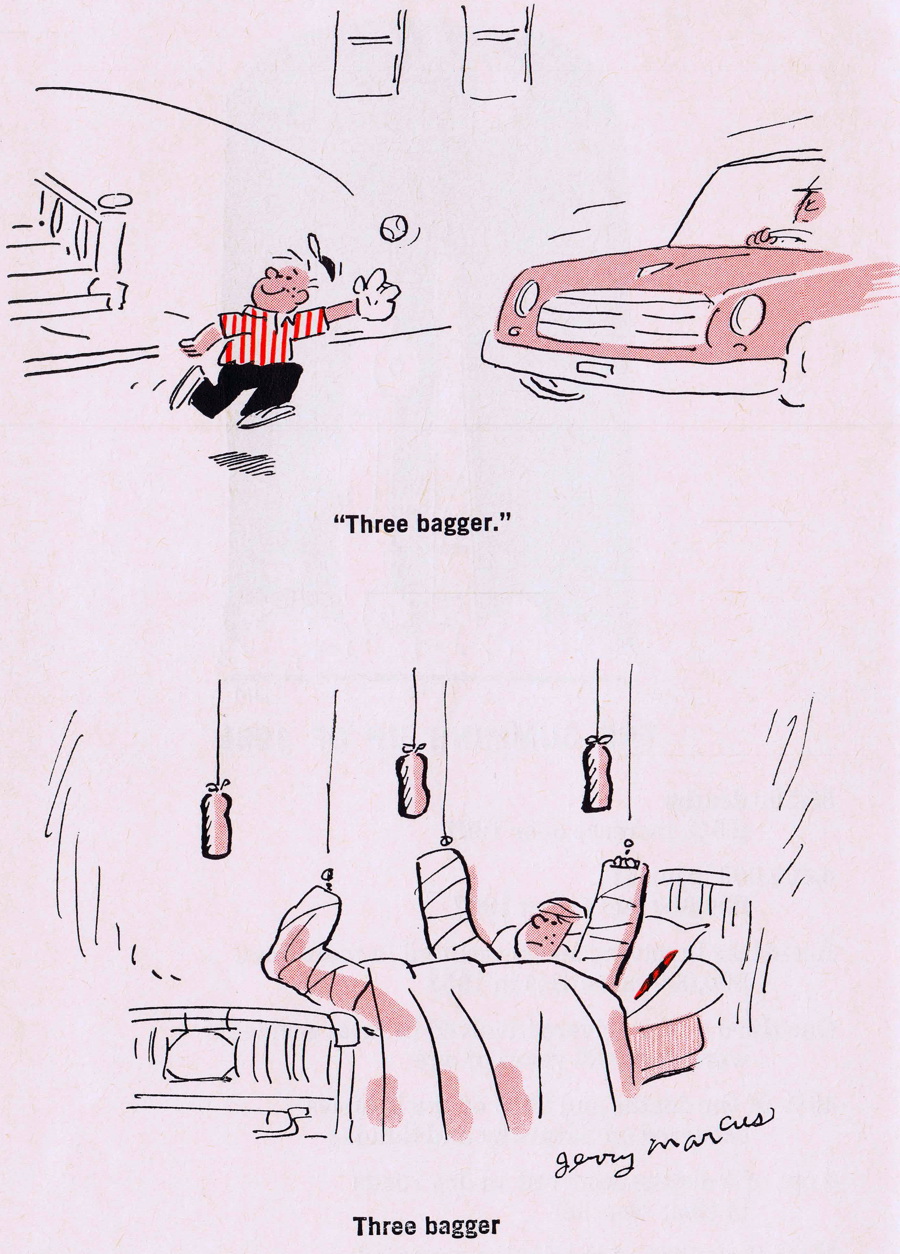
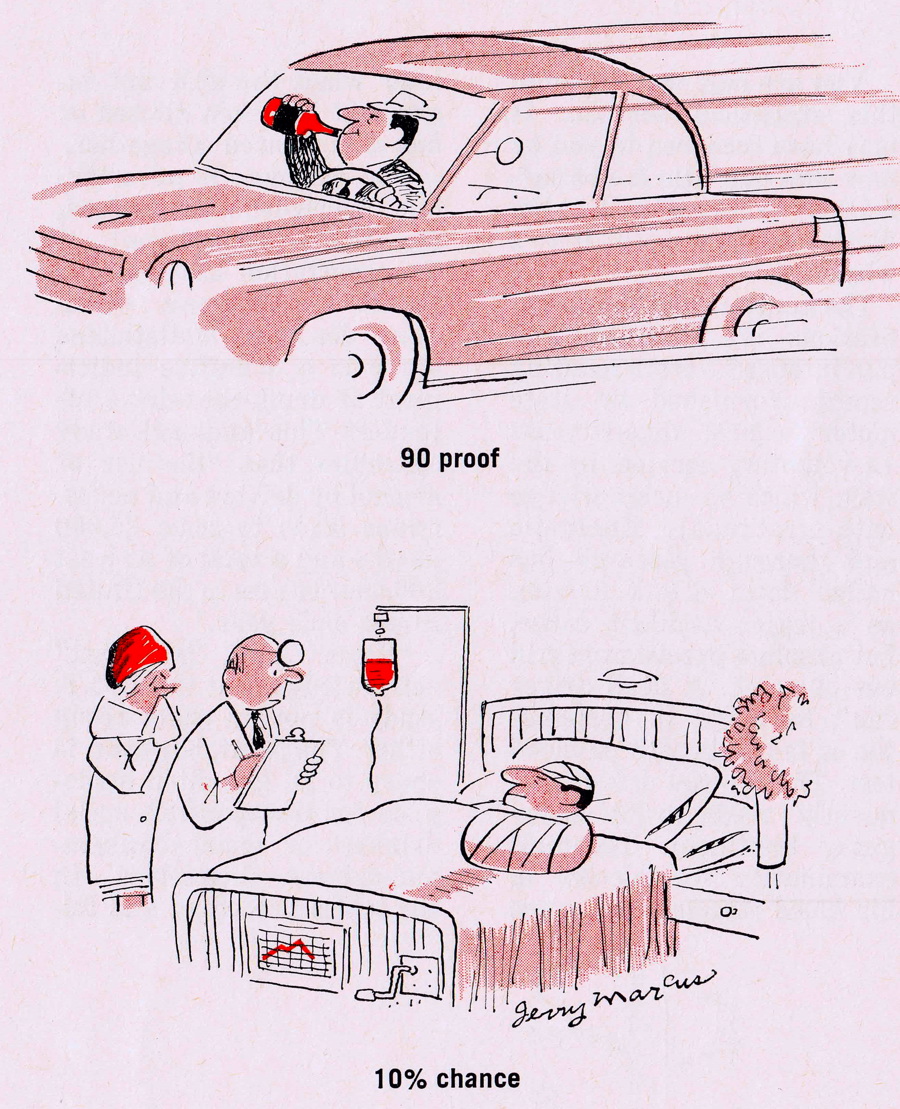
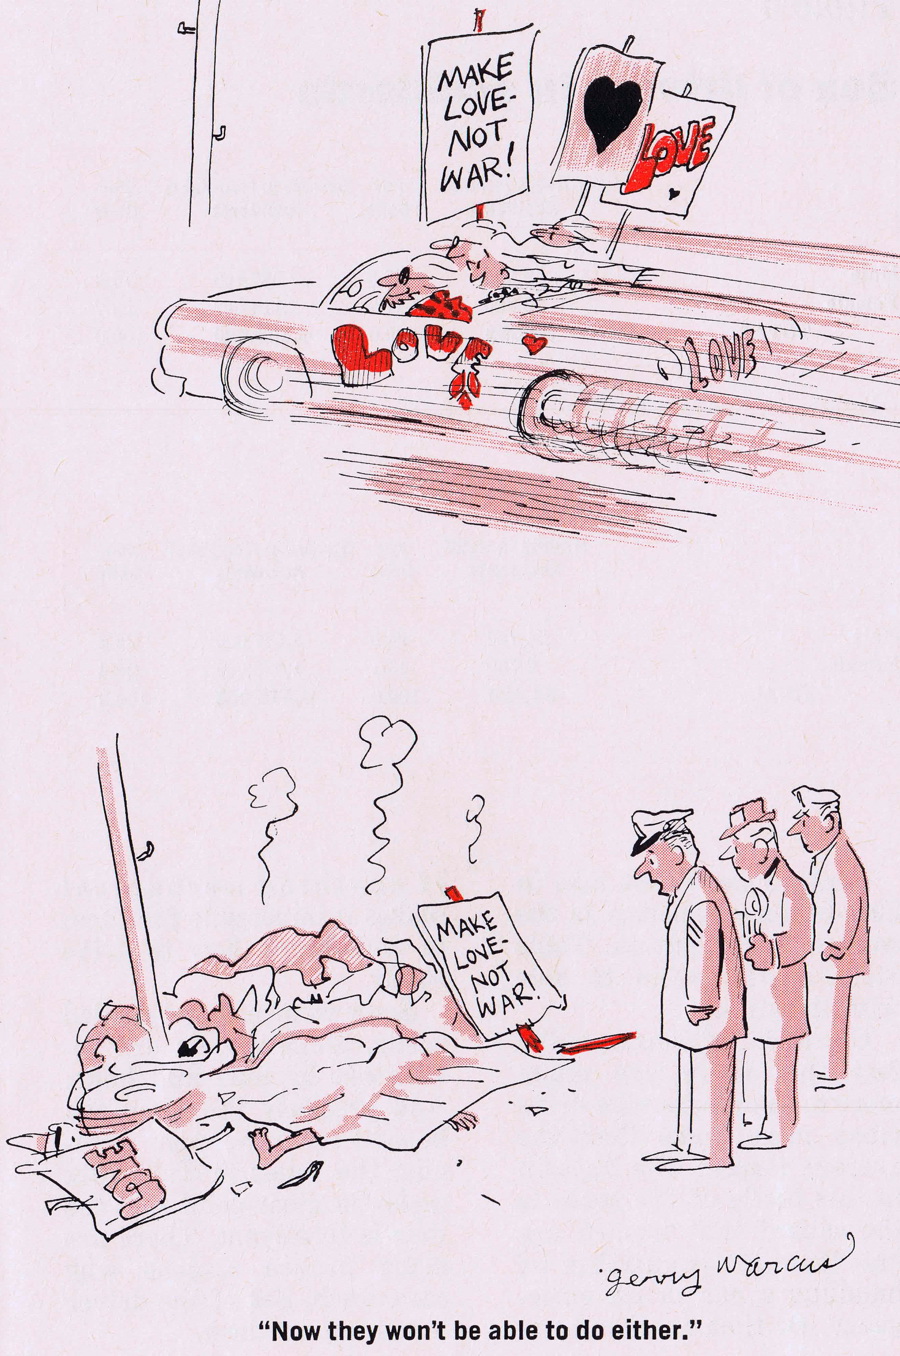
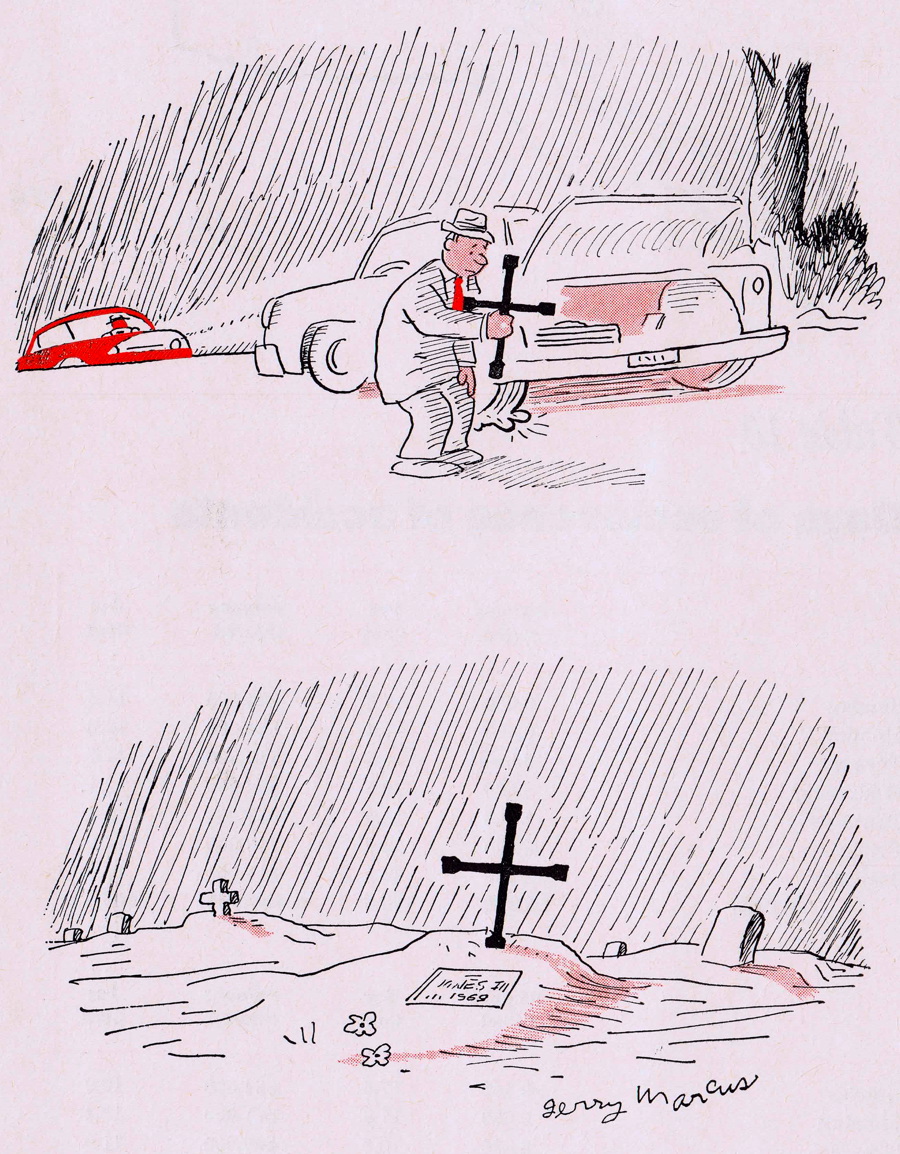
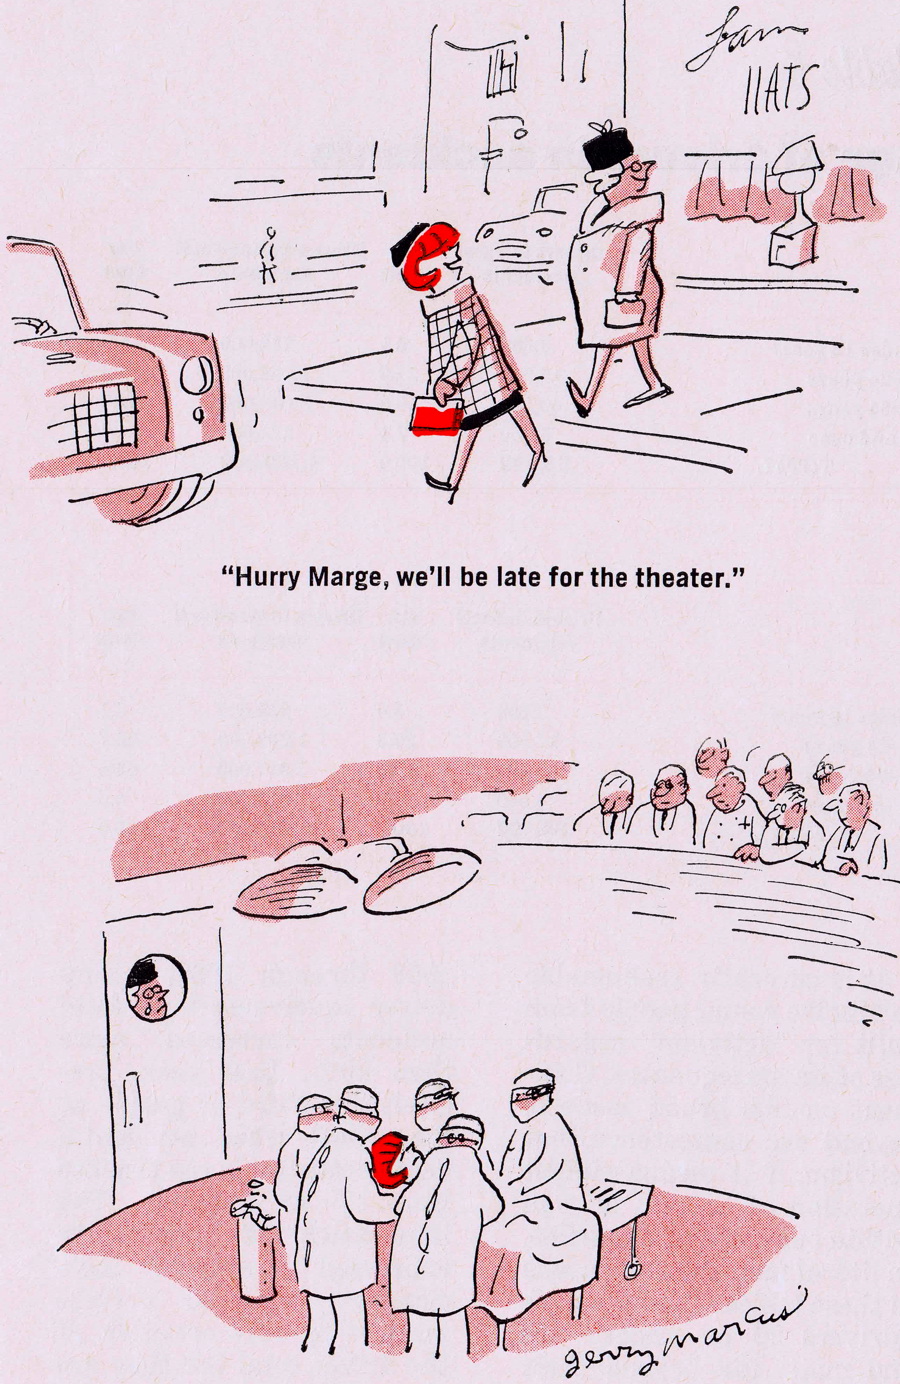
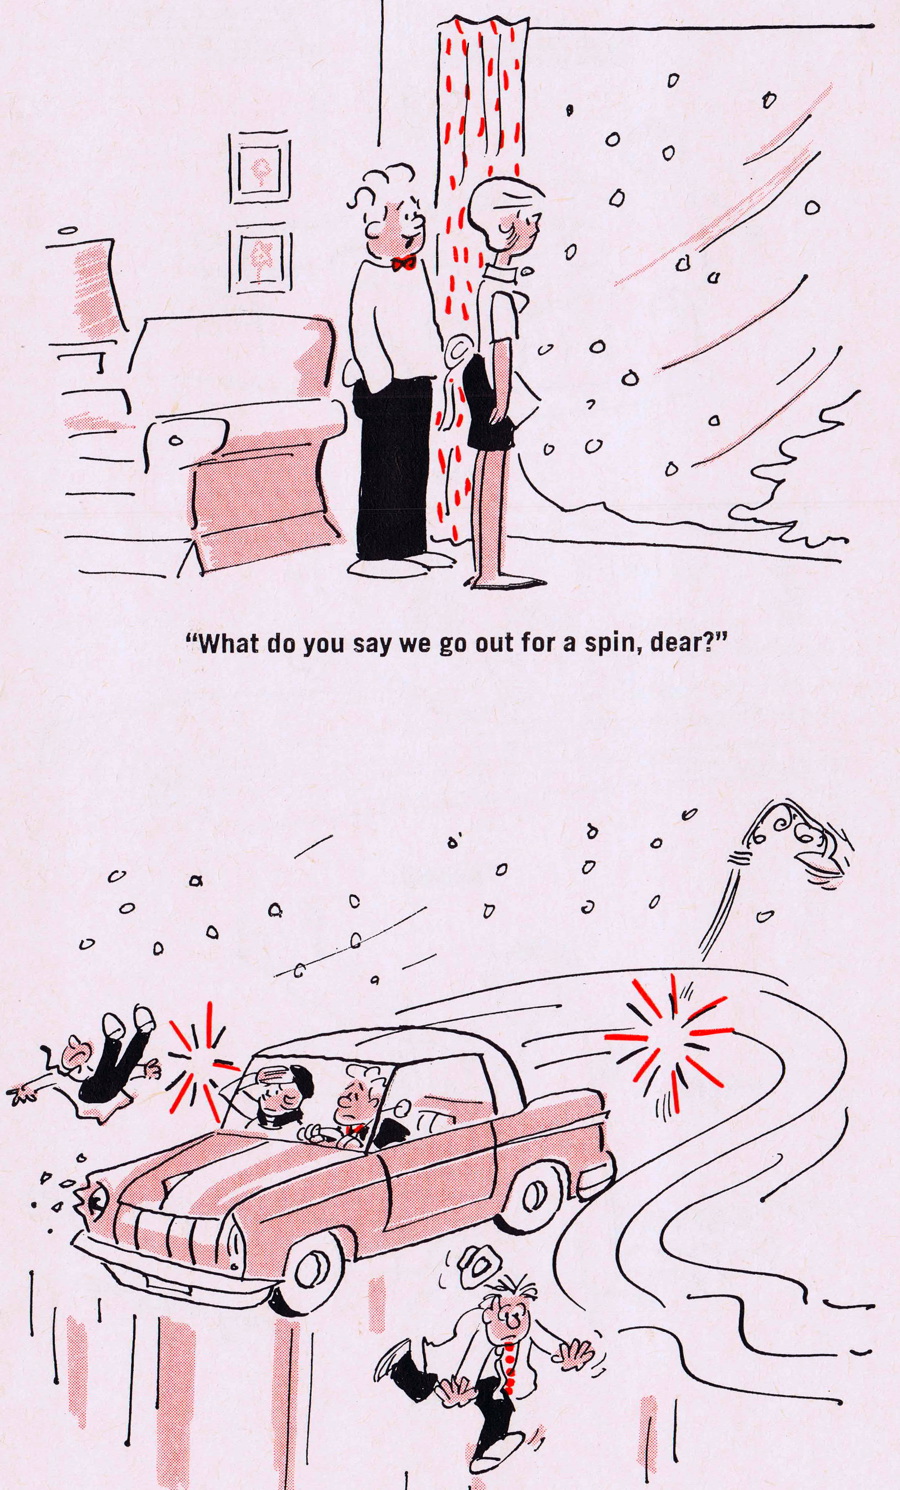
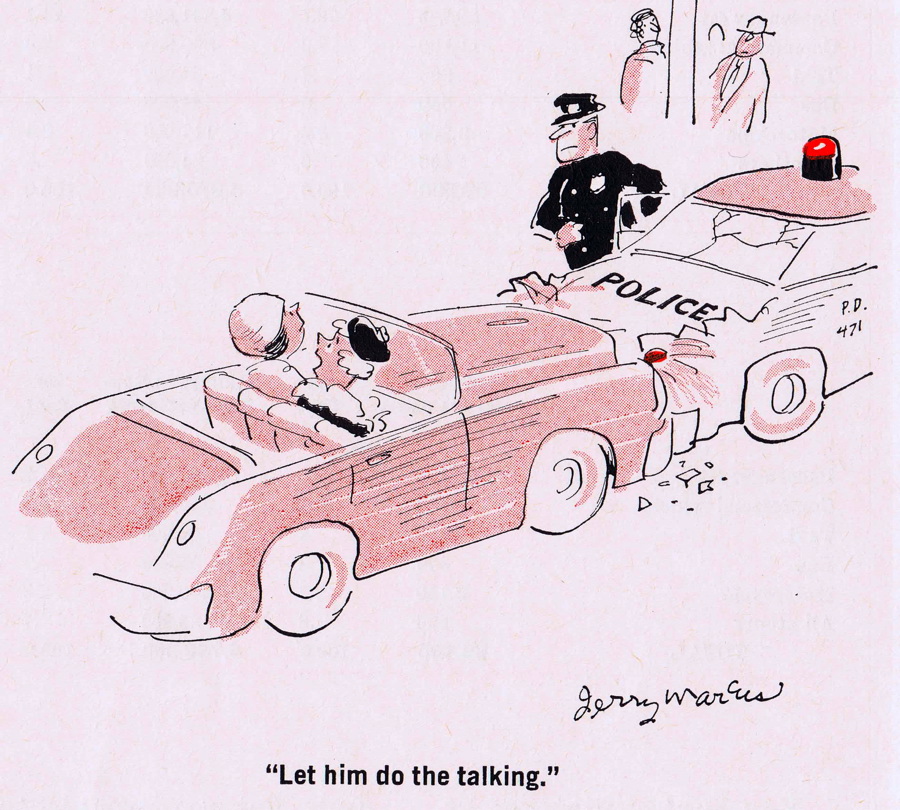
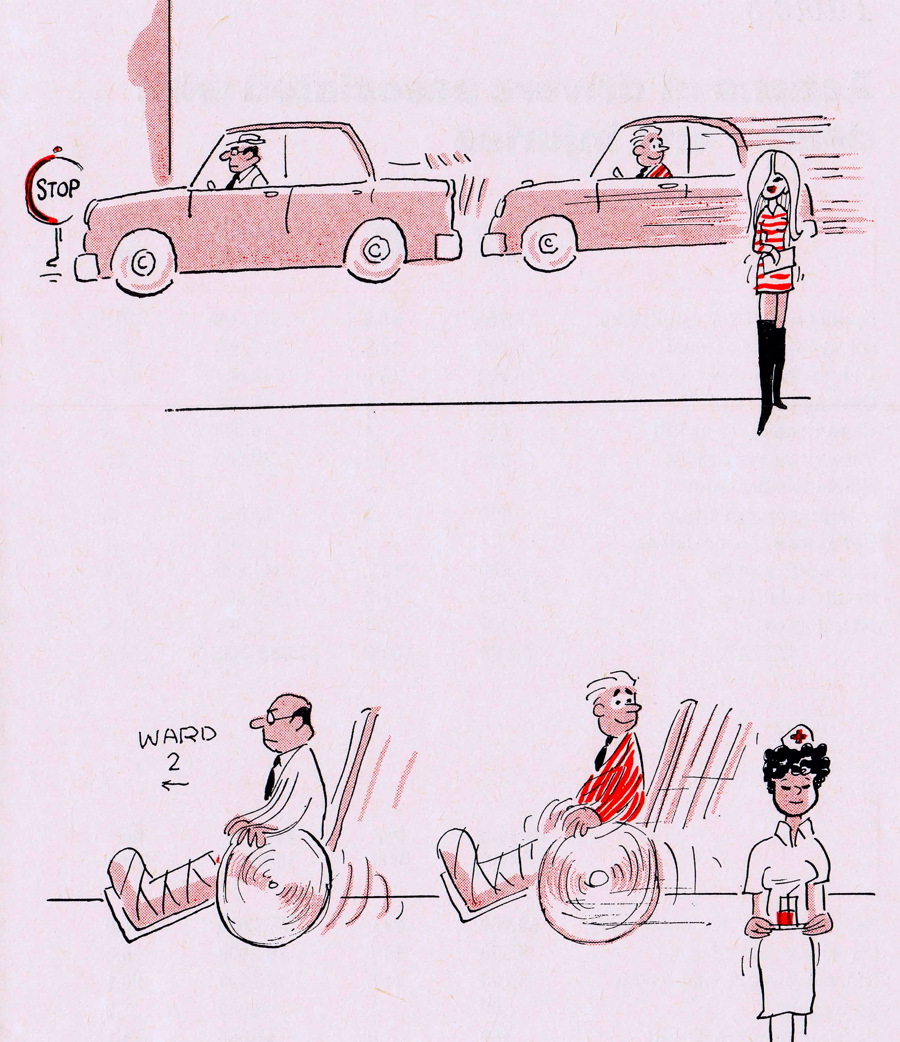
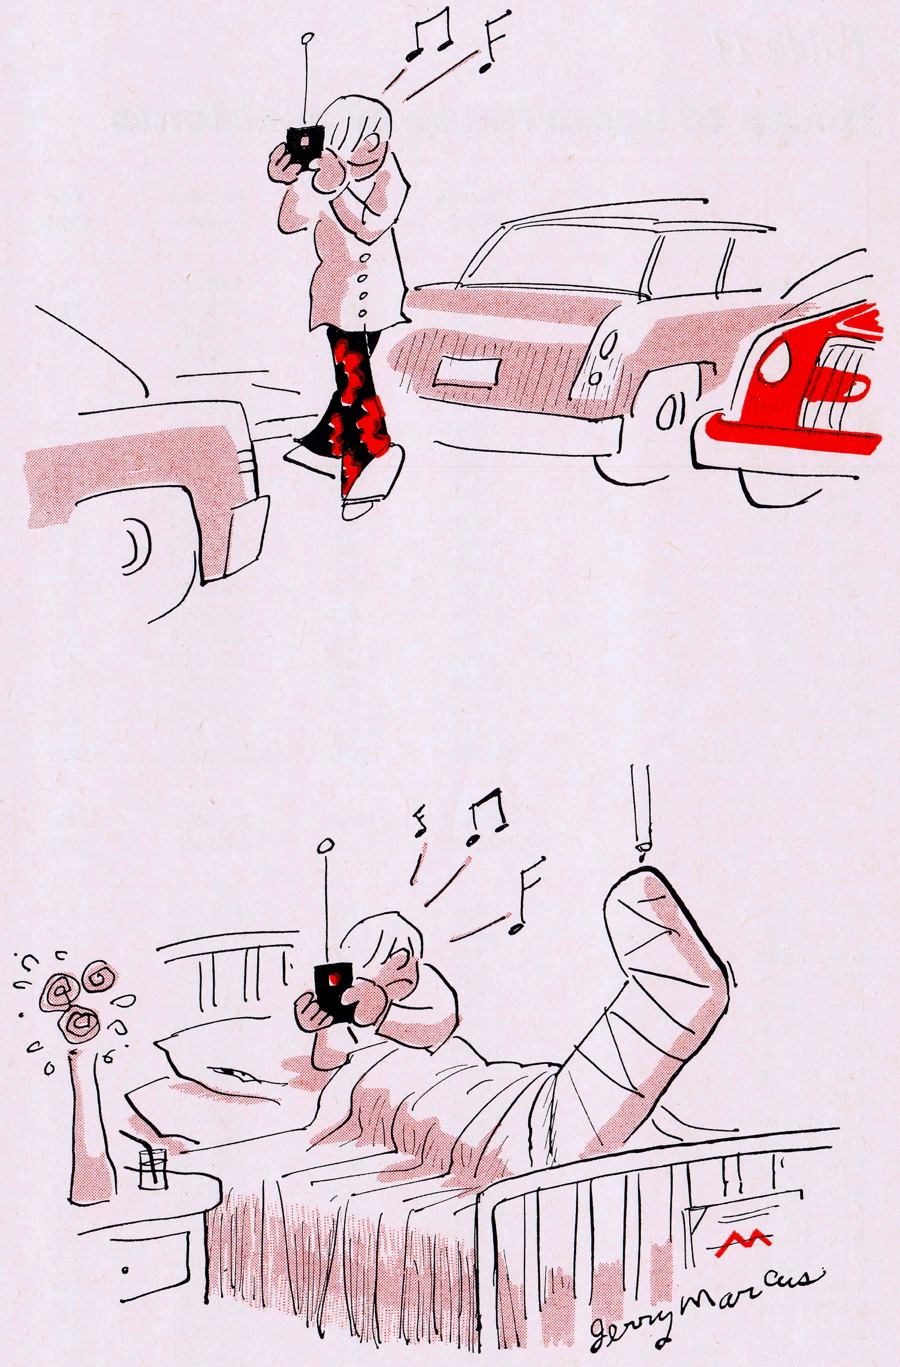
Travelers Insurance Company made the odd choice to illustrate this booklet with cartoons from an artist named Jerry Marcus. The cartoons show traffic calamities in a humorous way, as if there was something funny about the statistics.
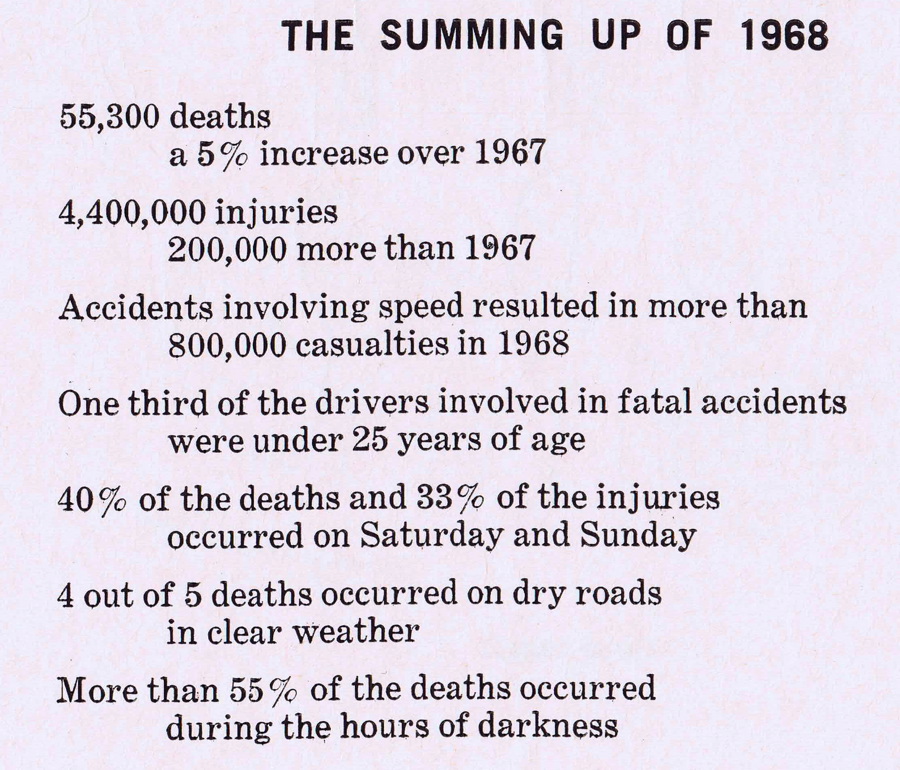
In 1968 there were, according to Alcoholocaust, 55,300 fatalities on the nation’s roads, and 4,400,000 injuries. Travelers describes 1968 as an “ugly year” for Americans and calls the traffic fatalities a “tragedy of spectacular magnitude.”
These numbers mean little in and of themselves; it’s only through comparison that we see how bad they really were. According to the National Highway Traffic Safety Institute, in 2009, there were 33,808 fatalities and 2,217,000 injuries–a reduction of almost 50%. This with a lot more cars on the road.
There are a few statistics that stay the same throughout the years, even though the total numbers are down. The most fatal accidents are caused by speeding (40%), followed by “reckless driving” (14.7%).
Men, both then and today, are involved in more fatal accidents than women by an almost two-to-one margin. I don’t know if this is because there are more male drivers on the road or because men are worse drivers than women. It may be telling that more women are injured in traffic accidents than men, possibly because they are more likely to be passengers.
The age of drivers involved in fatal accidents are not directly comparable between 1968 and 2009 (due to different accounting methods), but in 2009 it was 21 to 24 year olds that had the highest death rate, and 16 to 20 year olds that were injured the most.
The pamphlet doesn’t break out the number of traffic accidents caused by alcohol in 1968, but it’s assumed to be a large percentage. I do know that in 1982, 48% of traffic fatalities involved alcohol. By 2009 that number was down to 32%.
It may not be surprising, then, that the highest number of traffic fatalities occur between the hours of midnight and 3 AM, both in 1968 and in 2009. During these hours, even in 2009, 66% of accidents involved alcohol.
Looking at the traffic accident death rate per 100,000 people highlights the difference between then and now. In 1968 it was approximately 26 deaths per 100,000 people. By 2009 it had dropped to 11. We’ve come a long way.
The only thing that seems to have gotten worse since 1968 is the amount of accidents caused by “distracted driving.” No one measured that statistic in 1968, but in 2005 distracted driving was cited in 10% of traffic fatalities. By 2009 that number had risen to 16%. Are cell phones and fast food the new alcohol? Only time and data will tell.
Another surprising statistic from the most recent traffic safety data is that 27.8% of traffic fatalities in 2009 involved drivers or passengers who were not wearing their seat belts. I thought everyone buckled up these days.
I’m glad we live in times where your chance of death in a traffic accident is half of what it was in 1968. I started driving in 1972 and often marvel at the fact that I wasn’t killed tooling around Los Angeles in my first car, a 1960 Chevrolet Corvair. But then I didn’t drink and was lucky not to fall victim to the alcoholocaust. And now that I’m old I know to stay off the road between midnight and 3AM.
Follow Gene on Twitter: https://twitter.com/SAWG
This article was last modified on May 15, 2023
This article was first published on January 14, 2011
Commenting is easier and faster when you're logged in!

Recommended for you

Tip of the Week: Fast Edit Original
The fastest way to open a placed image in another application for the purpose of...

Building Presentations in InDesign
Mark Heaps shows how to craft presentations in InDesign that are both beautiful...
Accentuating Paragraphs With Borders and Shading
How to use borders and shading features to make your designs pop by adding a col...