
InReview: Build-a-Graphic
Great presentation graphics are just a click away with this PowerPoint add-in.


This article appears in Issue 21 of CreativePro Magazine.
Adding professional-level vector graphics to PowerPoint can be a challenge even for seasoned designers. SmartArt is woefully dated, icons take you only so far, stock graphics can get expensive quickly, and creating detailed graphics from scratch can be immensely time-consuming.
That’s where Mike Parkinson’s Build-a-Graphic add-in for PowerPoint comes in. It gives you one-click, fully editable, pro-level graphics ready for customization—all without ever leaving the program. And with a recent update, it has gotten even slicker and is now available for macOS as well as Windows. Let’s take it for a test drive to see if it’s worth adding to your presentation toolkit.
Installation
Installation of the Build-a-Graphic add-in is a breeze, having gotten much easier with the recent release of the updated version as an Office add-in. (For more information on PowerPoint add-ins in general, check out “PowerPoint Add-Ins: Faster, Stronger, Better,” Issue 8.)
Instead of downloading a separate installer, you can now activate the software within PowerPoint. Go to the Office Add-in Store under Get Add-ins on the Insert tab. (If you’re working on a small screen and don’t see this option, look first under the Add-ins submenu.) Once in the store, search for Build-a-Graphic.
After you click Add (Figure 1) to install the add-in, you will see a new icon on your Home tab. Click it at any time to bring up the dedicated Build-a-Graphic panel. There, you’ll first see a Buy Now button that will take you to a website where you can purchase a subscription license.
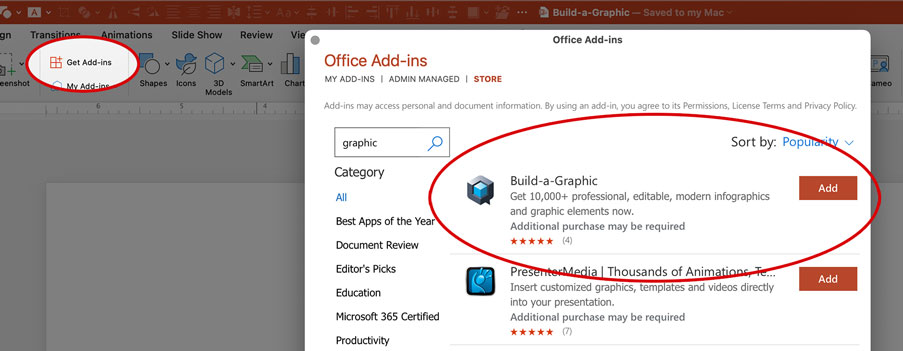
Figure 1. Install the Build-a-Graphic
add-in from the Office Add-in Store via the Get Add-ins button on the Home tab.
As an Office add-in, Build-a-Graphic will be tied to your Microsoft account and will be available on any computer on which you are signed into Microsoft 365.
Searching and Inserting Graphics
The Build-a-Graphic user interface is minimal, consisting mostly of a single search bar from which you can access more than 10,000 available graphics (Figure 2). The keywording is excellent and extensive, but while the most relevant graphics are placed at the top of results, you’ll find no support for Boolean searches. A search for business process yields results for graphics tagged with business or process, although graphics containing more keywords will be ranked higher.

Figure 2. Build-a-Graphic’s panel has a single search bar that quickly returns results from the 10,000-item catalog.
There is also no way to browse the entire catalog. But each graphic you click from the search results displays every keyword associated with that graphic as a hyperlink to perform a new search, so you can easily follow these linked keywords deep into the catalog to explore its offerings (Figure 3).

Figure 3. Keywording is extensive for each graphic, and clicking each word launches a new search to go deeper into the catalog.
Tip: If you’re looking for a multi-part graphic, just type the number, such as 4, rather than 4-part process to get the most useful results.
You’ll most likely want to start working with a graphic on its own slide. Click Insert Graphic to do so.
The vector graphics come in looking exactly as they do in the panel preview because all colors have been applied individually and not using the PowerPoint color palette. The graphics maintain their design integrity, including shading and dimension, but if you want them to match your template using your brand’s colors, you’ll have to manually apply those values. And with some graphics, that could take a bit of time.
Graphic Style
The catalog of graphics is tasteful and consistently designed, having come mostly, one assumes, from the hand of Mike Parkinson, an experienced presentation designer and digital illustrator.
The abundance of flat, three-dimensional, and even isometric graphics makes it easy to find a style that’s right for your presentation and then mix and match elements across multiple slides (Figure 4). You can select from character and object illustrations of all shapes, sizes, and icons, both individually and as part of larger graphics. And maps! You’ll find hundreds of world and country maps ready for quick highlighting, say, of a small island in Indonesia, for example.
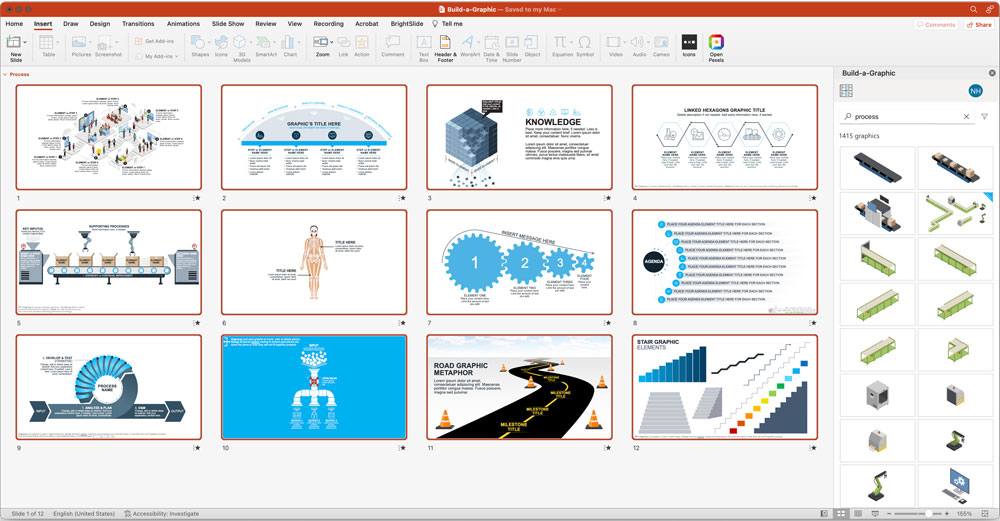
Figure 4. Just a few of the 1,400+ search results for process
Editing
It’s clear that a lot of attention has been paid to making the graphics as editable as possible. They come in as grouped PowerPoint shapes that you can immediately start recoloring, deleting, or adding elements (including text) to, and even animating. The coloring and stylizations were designed to be as neutral as possible, but you’ll almost always want to tweak things here or there to make them your own. You’ll generally find it very easy to mix and match to make new graphics of your own. I spent a little time sorting through some graphics and put together my own slide on the process of creating a quantitative presentation using various Build-a-Graphic elements (Figure 5). It took me about 30 minutes, but I can only imagine how long it would have taken to make something like Figure 6, from scratch.
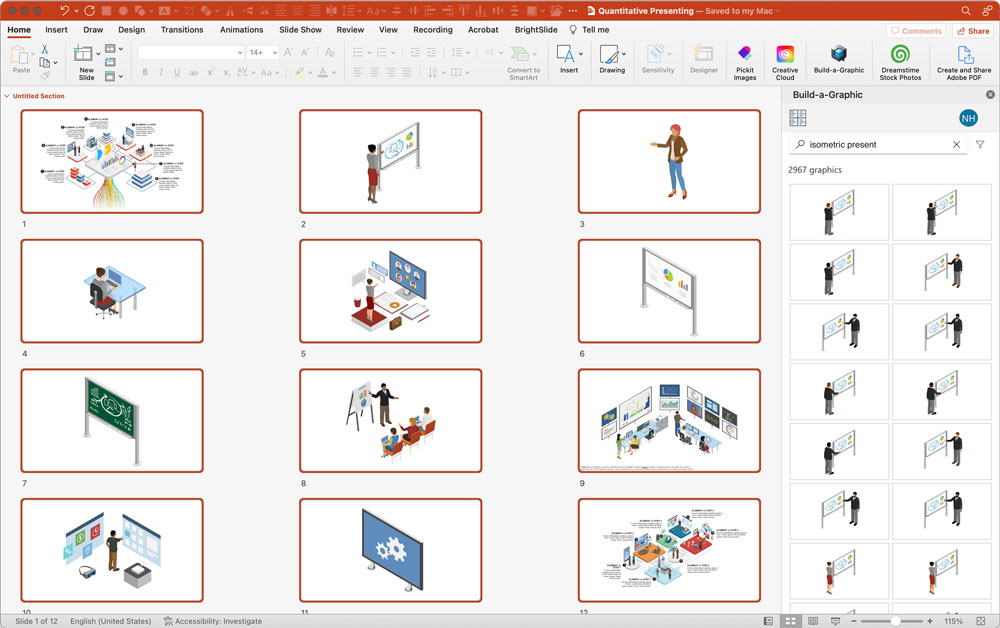
Figure 5. I searched the catalog to find isometric elements to use in my own process graphic.

Figure 6. In about 30 minutes I created my own isometric infographic, something that would have taken me hours, if not days to do from scratch.
Licensing
All graphics are royalty-free, meaning you can use the graphics in part or whole in any materials, in or outside of PowerPoint. And you can continue to use any downloaded graphics if you let your subscription lapse or cancel it.
Say Goodbye to Bullet Points
The add-in also has another small, but very useful trick up its sleeve to help you avoid the notorious “death by bullet points.” Select any text box of bullets and click the icon at the top left of the panel to divide your text into individual text boxes by “chunking” them out (by sentence, bullet, or paragraph). Although there are other ways to break apart a single text box of bullets (including converting it to SmartArt), having the tool at your fingertips is a great aid. Because nearly all of the add-in’s graphics involve chunked out text, you’ll most likely want to separate your bullets into individual boxes at some point (Figure 7).
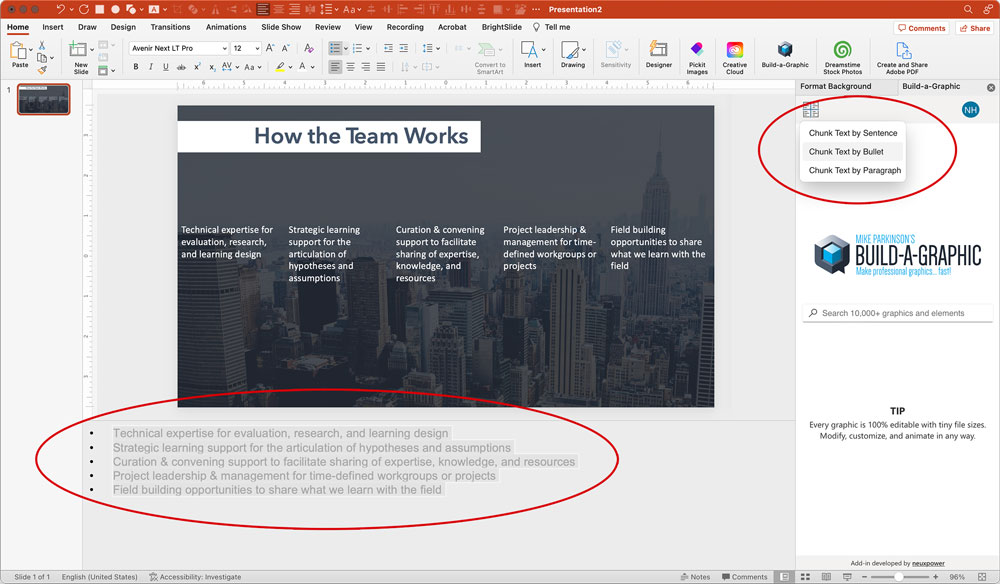
Figure 7. Use the “chunking” feature to separate your bullet points into individual text boxes. It even works on text in the speaker notes.
Pricing
Build-a-Graphic is priced as an annual subscription of $199, which includes all automatic updates. (Content is continuously being added to the catalog.) The subscription auto-renews, but you can cancel at any time. The price is one of the highest around for a PowerPoint add-in, and that may deter many casual users. If you’re just looking for an occasional set of arrows or Venn diagrams, it may be more cost-efficient to source graphics from stock sites or even PowerPoint’s built-in tools. But if you regularly find yourself in need of quality process graphics and infographics or if you have an important presentation for which you need a pro-level graphic ready to edit in PowerPoint, Build-a-Graphic may be exactly what you’re looking for. Unlike most PowerPoint add-ins, Build-a-Graphic provides actual content, not just productivity tools. If you wouldn’t bat an eye at hiring a graphic designer or downloading expensive stock from Getty Images, then this add-in might be a no-brainer for you. Always keep in mind what your own time is worth and how many hours of our lives we all have spent meticulously piecing together and fiddling with a PowerPoint graphic.
Final Thoughts
If you’re used to making your own graphics in Illustrator or sourcing vectors from stock sites, you might find Build-a-Graphic’s 10,000 item catalog a bit wanting when searching for something very specific. But if you’re interested in ready-to-go proven graphics at your fingertips in PowerPoint, you’re almost certain to find amazing content and spend a fraction of the time you would to create professional-looking and graphically rich slides. Just the other day, I used Build-a-Graphic to offer a client a half dozen options for an organizational framework in a fraction of the time it would have normally taken me poring through stock sites, spending money, and going back and forth to Illustrator. And as far as I know, my client probably thinks I created each and every graphic from scratch. Thanks, Build-a-Graphic!
Summary
- By Billion Dollar Graphics
- $199 annually (Use the discount code BAG20DISC for 20% off the first year.)
- Requires PowerPoint
- Rating: 4.5 stars
Commenting is easier and faster when you're logged in!

Recommended for you
Free Script to Rotate Selected Characters
InDesign allows you to rotate text characters if you convert them to outlines. B...

InDesign Magazine Issue 100: 100 Tips, 100 Free Scripts
We’re happy to announce that InDesign Magazine Issue 100 (August 2017) is now av...

Tackling Tables through Scripting
Tackle tables through Javascript, for instant formatting. And a bonus: download...