


I try to tell my kids what it was like back in the day before the answers to every question were just a click or tap away. To get information on an obscure topic you’d actually have to get in the car, go to the library, and look in the right books. Gathering information took effort. Today, we have the opposite problem: with our many screens, we’re caught in a blizzard of data, bombarded with facts and figures from every angle. How to make sense of it all and communicate meaning is the job of the designer. And a daunting job that can be! That’s why Tony Harmer’s course, Creating Infographics with Illustrator, is a welcome addition to the Lynda.com offerings.
Here’s the official course description:
Infographics visualize your data and help to tell the story behind it. In this course, Tony Harmer shows how to design charts, graphs, and other infographic components in Adobe Illustrator. He shares some sources of data that you can use in production, and reveals five key components of a great information design. He then takes you through the various types of tools, charts, and functions that you can use in infographic production, before wrapping up on how you can actually output your final product.
Topics include:
- Storytelling with data and graphic design
- Choosing the appropriate graph
- Getting data into Illustrator
- Defining the value axis for a chart
- Using graphic styles with charts
- Creating and applying a column design
- Making a rounded column
- Creating and applying a data marker
- Creating simple icons and color themes
- Exporting and printing the final product
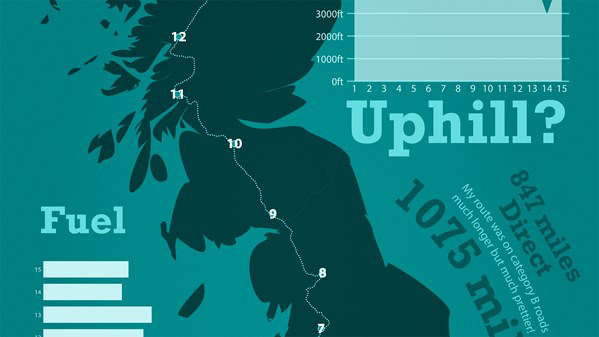
In the free movie below, Tony shares his method for planning out the design of a new infographic. Check it out!
Creating Infographics with Illustrator
Planning your infographic
For Lynda.com members, if you are currently signed in to your account, you can also check out these videos from the series.
Not a Lynda.com member?
Get 10 days of free unlimited access to Lynda.com.
Storytelling with data and graphic design
Online data sources for infographics
Top five infographic tips
This article was last modified on April 14, 2017
This article was first published on April 14, 2017
Commenting is easier and faster when you're logged in!

Recommended for you
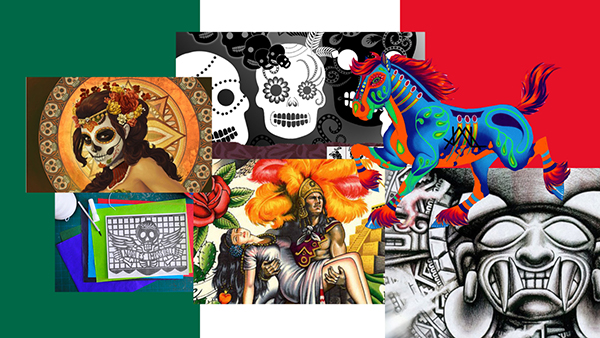
Art and Design Inspired by Mexico
Happy Mexican Independence Day!! What’s that I hear you saying? “It...

CreativePro Conference Speaker Spotlight: Sharon Steuer, the Zen Artist
Welcome to our new series of posts called Speaker Spotlight, designed to highlig...

InStep: Borrowed Design Elements
A systematic approach for turning inspiration into items you can use in your lay...