

In this week’s CreativePro video, Jason Hoppe shows off a couple of ways to add a bit of pop to Illustrator’s charts and graphs. He demos creating a bar graph with stair-step angles and shading, then shows how to add some depth to a pie chart. This clip comes from Jason’s “Charts and Graphs” session at CreativePro Week 2019.
New videos every Tuesday on our CreativePro YouTube channel. Be sure to subscribe so you don’t miss any!
This article was last modified on August 29, 2025
This article was first published on April 15, 2020
Commenting is easier and faster when you're logged in!

Recommended for you

How to Create 3D Objects Quickly in Illustrator
See how easy it is to create great looking 3D objects in Illustrator quickly. Us...

InDesign Magazine Issue 96: Type FX
We’re happy to announce that InDesign Magazine Issue 96 (April 2017) is now avai...
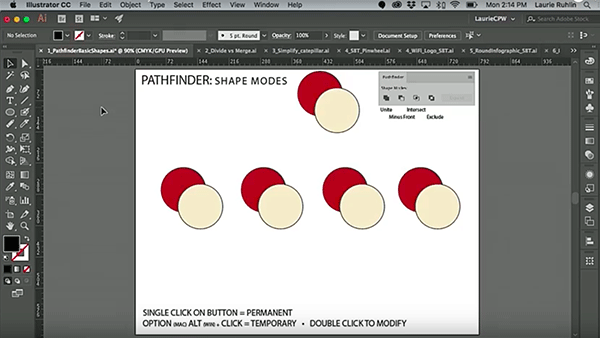
CreativePro Video: Illustrator’s Pathfinder Panel
In this week’s CreativePro video, Laurie Ruhlin takes the mystery out of Illustr...