
Data Merge Magic
Easily transform your plain spreadsheet data—and lots of it—into an InDesign masterpiece


This article appears in Issue 140 of InDesign Magazine.
Imagine you manage your marketing data in a spreadsheet, and now you need to turn it into something amazing in InDesign. Something visually appealing and intellectually compelling. Something that’s not a table.
What’s a marketer to do?
Enter InDesign’s Data Merge function, which marries spreadsheet data with InDesign’s design functionality. Simply put, Data Merge allows you to drag fields into your document, apply formatting to the content with styles, and place it into a series of frames.
Data Merge is a wonderfully robust function that can make common marketing tasks a breeze. Team member resumes, project sheets, company introductions, image file names—Data Merge can handle them all. If you can store it in a spreadsheet cell (including image file names), then you can use Data Merge to transform it into an auto-styled element.
But, what if your images are spread across multiple servers? No problem—you can store platform-style image paths in your spreadsheet. Data Merge will find and place the image into its designated InDesign location. That’s right: You can automate image placing from multiple locations in InDesign. Did this just get a lot more interesting, or what?
Could this solution help develop project description pages? Org charts with staff photos? Charts? In a word: Yes!
Auto-Filled Project Description Pages
Let’s start with creating project description pages. Figure 1 shows the content I stored in a spreadsheet. It includes an image file name as well as project information common to Statements of Qualifications (e.g., project name, owner, contact, cost).
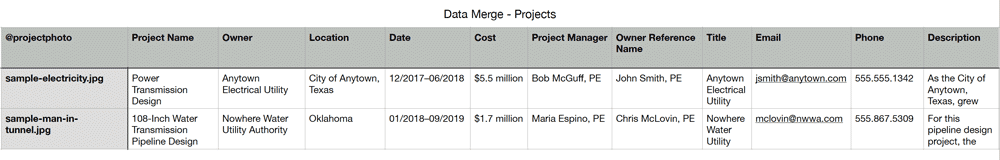
Figure 1. The original spreadsheet data
Figure 2 shows the output from InDesign after I used Data Merge.

Figure 2. The finished product
Once your Data Merge parameters are set up, you’re just a couple clicks away from project sheet completion! Just follow these steps to go from spreadsheet to finished document.
Make sure the top spreadsheet row serves as the column field labels (e.g., Project Name). Save your spreadsheet as a CSV file. (Note: You can also use a tab-delimited TXT file or a semicolon-delimited text file, but I prefer CSV.)
Open an InDesign file and add the Data Merge panel to your workspace (Windows > Utilities > Data Merge).
Style your document with paragraph styles.
In the Data Merge panel, open the menu at the top right and choose Select Data Source. Navigate to your CSV file and click Open. (Note: This will add the CSV file to the Links panel as well.)
You’ll see the list of column fields in the panel. Drag the fields onto your page in the appropriate locations with the styles applied. Don’t need all of the fields in the spreadsheet? No problem! Drop in only the ones you need. For the example project, for instance, I did not need the Location field (Figure 3).
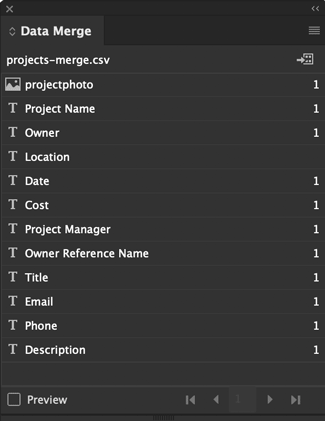
Figure 3. The Data Merge panel shows the column headings from the CSV file.
Save the file. (I usually add the phrase merge code to the file name.)
Back in the Data Merge panel menu, select Create Merged Document. In the dialog box, choose which records you want to merge, along with how many records per InDesign document page. For this example, I chose one record per page. Click OK. Your merged document will open as a new file with -1 at the end of the file name.
And just like that, you have two complete, styled project sheets with images. Fantastic work!
What if a Source Spreadsheet Is Updated and Edited?
Finding out that a colleague added or subtracted information in your source spreadsheet can incite more than a little panic. But not to worry! While Data Merge does have a way to update already-created documents, it’s kind of fiddly. Often, the faster method is to reopen your saved merge code document, update the modified link (you will see an alert notification, or you can choose Updated Data Source from the Data Merge panel menu), and then choose Create Merged Document again.
Other Content You Can Automate
Let’s tackle a tricky and often tedious topic: org charts. My article from Issue #137 covers creating org charts using InDesign’s Gridify feature with text frames; but in this example, we want to merge org chart data stored in a spreadsheet with images, data, and glyphs representing work with a fictitious client, Anytown. As in the project description page example above, I first assigned each column a style.
As illustrated in Figure 4, I added one column (@photo) with image file names for staff photos and three columns for additional staff data (Role, Name, and Firm). The fourth column, Client Understanding, will store the data to indicate whether the staff member has worked with the client. For example, if Maria has worked with Anytown, a checkmark goes in the column. If Bob has not worked with Anytown, a stylized X will be the indicator. With a little research, I discovered the Wingdings 2 font where o is a checkmark and p is a stylized X. Perfect! I added an o or p in the spreadsheet column and set up a corresponding paragraph style in InDesign using Wingdings 2.
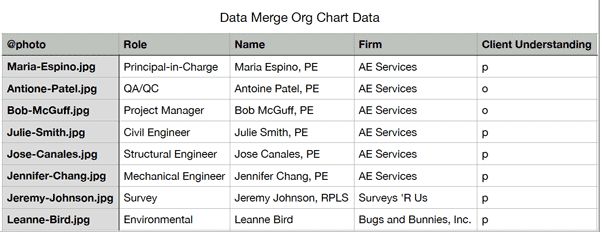
Figure 4. The CSV file that will serve as the basis of my org chart, complete with platform-style image paths
(Note: If the CSV file lives in the same folder as the images, you do not need the full path. If the images live elsewhere, then you have to include full path links, using OS-appropriate delimiters.)
Now we need to set up the InDesign file. For this example, in addition to the photo column, I created four paragraph styles, one for each text column header: Name, Role, Firm, and Client Understanding.
With these ready to go, you can follow the Data Merge steps outlined in the project description page example. When you get to Step 7 (create the merged document), visit the Records per Document Page section and choose Multiple Records from the menu.
Next, select the Multiple Record Layout tab at the top of the dialog box (Figure 5) and set the margins, layout, and spacing.

Figure 5. The Multiple Record Layout tabs allows you to customize your settings for your merged file.
Turn on Preview Multiple Record Layout to preview your design. You may need to adjust the settings (such as margins and spacing) to achieve the desired outcome. The good news is, once it’s done, you don’t have to choose these settings again.
Create your merged document (Figure 6), add some connecting lines, and relish in your brilliance!

Figure 6. Check out your org chart data from Data Merge! Just add the lines and rearrange to your liking, and you’re done!
Making Charts
For this example, we will use the data from the spreadsheet shown in Figure 7 to create the charts in Figure 8.
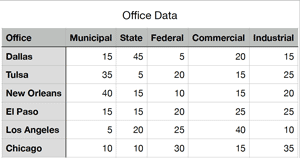
Figure 7. The raw data we’ll base our charts on
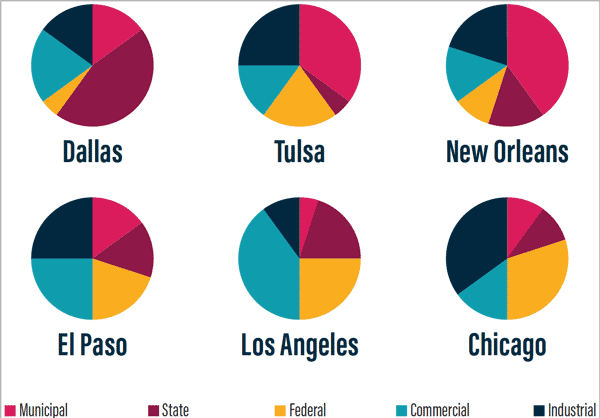
Figure 8. Finished charts, produced with a little help from Chartwell. Note: The legend at the bottom is not automated; I manually added it on the master page.
For this particular Data Merge magic to work, you will need to purchase the powerhouse typeface Chartwell (available here). It’s truly brilliant and a must-have if charts are a part of your daily InDesign life. Plus, the font comes with a great manual that describes how to set up your styles. For more information on various ways of building charts, including using Chartwell, see Issue #126.
In simple terms for Chartwell pie charts, the font converts numbers into the percentage of pie shape, with a plus sign (+) between each number (Figure 9).
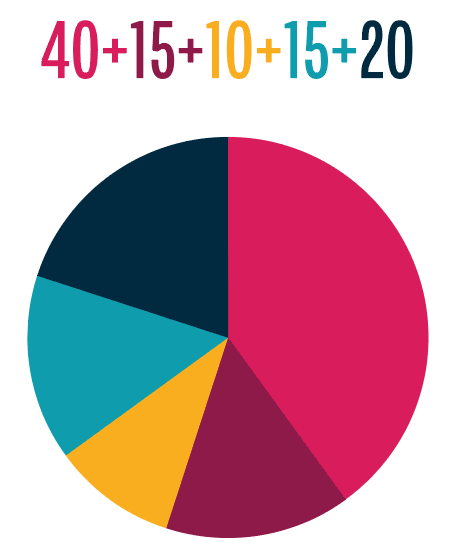
Figure 9. If you were to change the numbers to Chartwell pies, you would get the pie chart. It’s like magic!
To get started, create your paragraph style for Chartwell. Remember to enable Discretionary Ligatures in OpenType Features (Figure 10)!

Figure 10. Chartwell works only if Discretionary Ligatures is enabled in the paragraph style.
You will likely want your charts to be much larger than your body text, so you may need to bump up your font size to well over 100 pt to get to the visual weight you require.
Because this chart will have five pieces representing the markets in which our fictional firm works, we want each pie slice to be a different color. This means you need to create five unique character styles with only the color attributes applied.
In the Drop Caps and Nested Styles portion of the left-hand navigation menu, create a new nested style and choose the character style that you’d like to be the first piece of pie. (Note: If you haven’t set up character styles already, you can create them here in this dialog box.) Because the font works with a plus sign between each number but the sign isn’t visible in the graphic, you can choose for the character style to go through 1 + as illustrated in Figure 11.
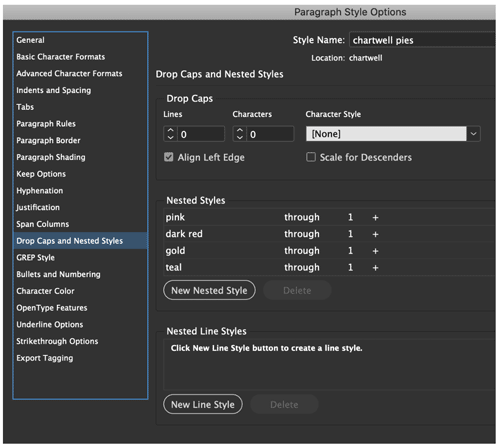
Figure 11. To automate the pie pieces as separate colors in the paragraph style, create a series of nested character styles with different color attributes.
Now set up the remaining four nested styles. To test out your new style, type numbers with a + between them and watch the chart come to life.
With your chart style defined, you next can create your remaining styles for the main header, office location, and market sector.
Follow Steps 1–6 as outlined above to get a document similar to Figures 12 and 13.
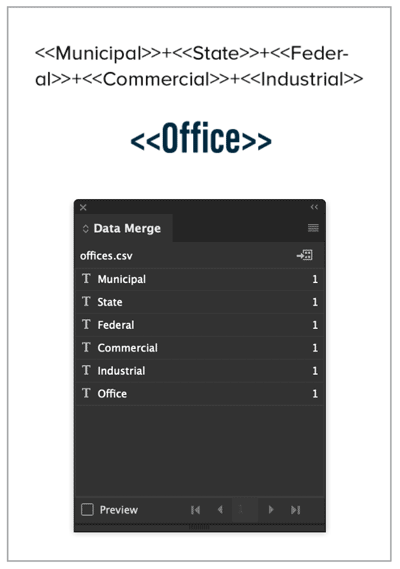
Figure 12. By dragging the codes from the Data Merge panel, you get something that looks like this, before changing to the Chartwell typeface.

Figure 13. After changing to Chartwell, your merged file may have overset text and odd-looking code, but fear not, it should look amazing once you create your merged file.
Now you’re ready to create your merged document. Choose Create Merged Document in the Data Merge panel menu. On the Records tab, choose Multiple Records per Page. Make sure Preview Multiple Record Layout is selected to see a preview of your finished file (Figure 14). On the Multiple Record Layout tab, make the appropriate spacing selections.

Figure 14. Select Preview Multiple Record Layout to see your data magic!
Click OK to create your merged document (Figure 15) and—BAM! Done!

Figure 15. Final pie charts automated from a spreadsheet using Chartwell
Show Off Your Efficiency!
With a little patience and practice, you’ll master the Data Merge feature in no time! Then, when you need to import a mind-boggling amount of information under a tight deadline, use the Data Merge skills you’ve learned to wow your team and your clients—and make yourself an invaluable asset.
All photographs used in this article are available on Unsplash.com.
Commenting is easier and faster when you're logged in!

Recommended for you

Preferences You Must Change in InDesign
Changing InDesign’s defaults is a must for the sake of efficiency and convenienc...

InDesigner: San Francisco Bay Brand
How consistent design and efficient processes make for a successful product pack...

InDesign Magazine Issue 109: Digital Asset Management
Issue 109 of InDesign Magazine include articles on digital asset management, col...