
I love pie charts and bar graphs. There’s nothing better than a visual representation of math or statistics to illustrate a point. For instance, did you know that four out of five designers (80%) who deal with statistics want to insert a pie chart in their documents, and would do it if it was easier to do? Or are you aware that the overwhelming majority of clients (90%) would like to see a bar graph in their statistical copy?
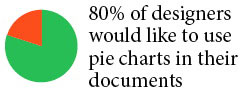
Figure 1: A pie chart can help visually illustrate statistical data.
OK, I made up these numbers. I have no idea how many designers and clients want charts and graphs in their layouts. But I do know that putting bar charts, pie charts, and line graphs into the text on print and Web pages isn’t simple. You have to go to a separate program, build the chart or graph, export it as an image, and then insert into the web or print layout.
But now, someone has finally made it simple—as simple as typing text—to create pie charts, bar graphs, and line graphs in text. The secret is an OpenType font called Chartwell available from TK Type. Chartwell has three font families: bars, lines, and pies. Each corresponds to the type of chart or graph. You can buy the three Chartwell fonts as a set for $50. Purchased individually, each costs $20.
Once you’ve installed Chartwell, all you have to do is type a simple “equation” (no high-level math required), apply the appropriate Chartwell font, and then turn on ligatures. The text numbers are converted into pie segments, bars, or lines.
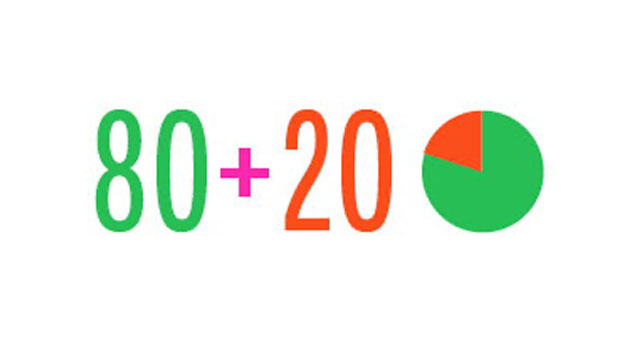
To create a pie chart, type as many numbers as you want that correspond to the segments of the pie. Insert a plus sign between the number for each segment. For instance, a pie chart with four quarter-segments would use the equation 25+25+25+25. A pie chart with the two segments, 80% and 20%, would use the equation 80+20. As you see, these numbers must add up to 100.
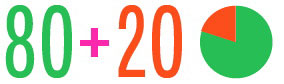
Figure 2: The plus sign between numbers creates the segments of a pie chart. The color applied to each number creates the color of the individual segment.
Bar graphs and line graphs work similarly: Each number in the equation corresponds to a segment of the bar or point on the line. Bar graphs appear horizontally in the text, but can be rotated to create stacked bars.
The advantage of using a Chartwell font is it allows you to type numbers that can easily be changed to modify the values of the chart or graph. The disadvantage is that the simple charts and graphs it creates might not be acceptable for more sophisticated layouts.
Chartwell comes in a desktop version that works with any word-processing or page-layout program that supports OpenType fonts and ligatures. There is also a Web version that allows you to apply the font and set the code that can then display the font on your web page. Note that inserting the Web font so that it works on a Web page is not a trivial matter and requires a good knowledge of HTML, JavaScript, and CSS.
Thanks to Bob Levine for providing technical support for this article.
This article was last modified on January 8, 2023
This article was first published on August 16, 2011
Commenting is easier and faster when you're logged in!

Recommended for you

TypeTalk: When In Rome
TypeTalk is a regular blog on typography. Post your questions and comments by cl...
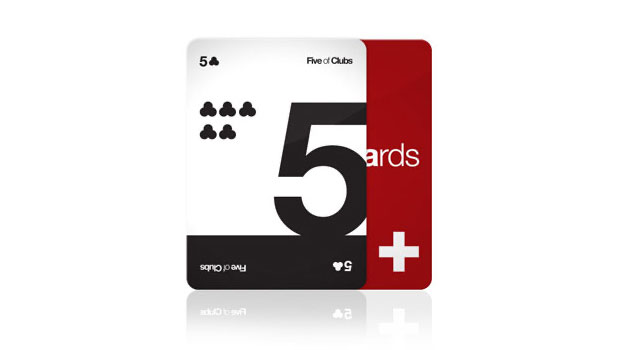
Love Helvetica? Love Card Games?
If you want to show your game-night buddies how much you love Swiss design, don...

Vernacular Typography Preserves Vanishing Species of Regional Type
When you go away on vacation, do you usually eat at a chain restaurant or a uniq...