

Let’s face it, Illustrator’s default charts are ugly. But that doesn’t mean you have to settle for ugly charts in your documents. You can customize the colors, remove the strokes, and create individual column, bar, and data point designs. Maybe most importantly, you can also add data labels to your graph columns. And you can do all of that while keeping the graph live, so it can be updated easily if the data changes. Like the graph function itself, none of this is new. But it has always been very well hidden, so most users don’t know about it. So, let’s explore some techniques you can use to improve the look of graphs in Illustrator.
Custom Columns
For a custom column or bar design you can use any Illustrator objects, even gradient meshes. You can include object fills with freeform gradients, but when applied to the bars you get a wrong result. Also, note that live effects and appearances will be expanded, so in order to modify or replace your graph design later on, you should save a copy of the original design.
The first thing to do is create the design to use in your graph. Keep in mind that the design will have to fit all the bars in your graph, from the shortest to the tallest. So, consider how you want to scale it.
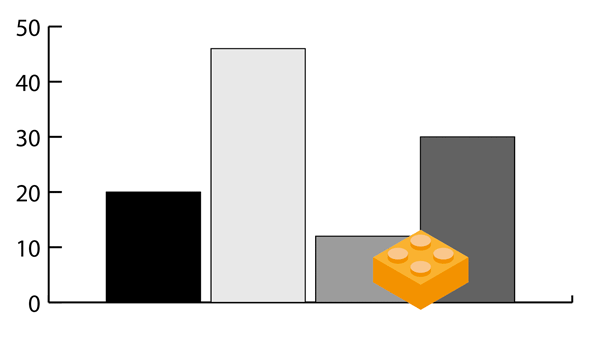
Figure 1: Comparing the column design to the actual columns to judge if this will work out
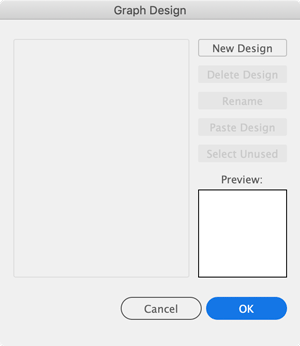
Next, select the finished design and choose Object > Graph > Design. In the dialog box, click New Design and then Rename to give your graph design a descriptive name. Click OK to close the dialog box.
class=”alignnone size-full wp-image-14359296″ src=”https://creativepro.com/wp-content/uploads/2022/02/custom-illustrator-graphs-fig2b.png” alt=”” width=”300″ height=”346″>
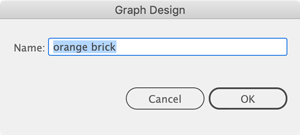
Figure 2: Creating a graph design
In order to apply the design to a graph, select the graph and then choose Object > Graph > Column. In the Graph Column dialog box, select your graph design and click OK.
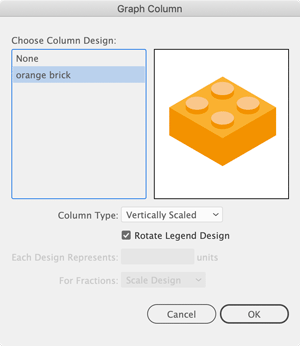
Figure 3: Selecting a design to apply to the graph
The only option you have when applying a design to a graph is the Column type, which determines how your design will be adapted to the height of the graph column. The default selection is Vertically Scaled, which just stretches or compresses the object. In some cases this will look OK, but it doesn’t work for the brick in our example.
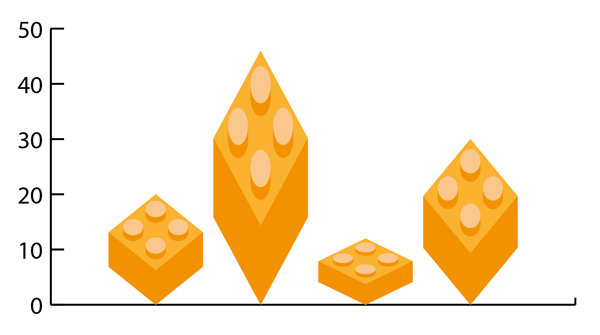
Figure 4: Lots of problems here. The perspective of the bricks is distorted. Their positions with the corner on the baseline looks wrong. And since the top of the bricks is a sharp corner, the reader cannot easily judge their exact height.
Fixing Scaling
The first thing we need to fix is the scaling issue. The columns need to be scaled in a way that doesn’t distort the top and bottom, just like with art brushes or symbol instances (9-slice scaling). In Illustrator graphs this is called a Sliding design.
In order to set it up, the design itself needs to be changed as well as the settings in the Graph Column options. Let’s take care of the design first.
Draw a horizontal line across the design at a position where scaling is possible without distoring the top and bottom. This serves as a kind of predetermined breaking point.
In the original brick it’s not possible, so the height must be increased slightly. Then put the line into position.

Figure 5: Left: The original design doesn’t have a workable breaking point. Right: A slightly taller version that can be broken. Tip: keep the guide as short as possible, just covering the width of the design.
Next, turn the line into a guide by selecting it and choosing View > Guides > Make Guides. Also, check that same submenu to confirm that guides are unlocked in the file.
Select the design and the guide, and make a new graph design by choosing Object > Graph > Design again. As before, give your new design a name and close the dialog box.
Then, select the graph and apply the new design using Object > Graph > Column. This time, select Sliding from the menu Column Type menu.


Figure 6: Applying a sliding design and the result
In the next step we’ll fix how the design gets scaled by setting up the reference for scaling. Illustrator uses an obscure method for this, which might be familiar to you if you have ever set up a pattern or a pattern brush.
In order to define how this design will be scaled to match the height of the original column, draw a rectangle that encompasses the portion of the custom design that should match the height of the graph column. This way, you can create some overshoot to compensate for visual perception.

Figure 7: When scaling the design, Illustrator will adjust it so the height of the rectangle matches the original graph column.
Set the stroke and fill of the rectangle to None and send it to the back (Object > Arrange > Send to Back). Also, check in the Appearance panel that the rectangle has no leftover effects or special formatting.

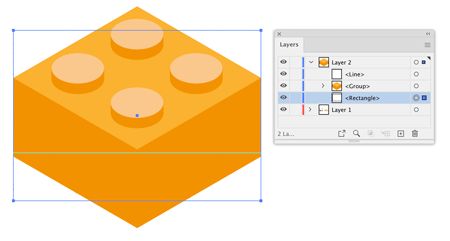
Figure 8: The stroke and fill of the rectangle (None) and its position in the stacking order (at the back).
Then, select the design, the guide, and the invisible retangle, and create the graph design as before. When applying it to the graph, make sure Sliding is still selected as the Column Type (this is easily overlooked).

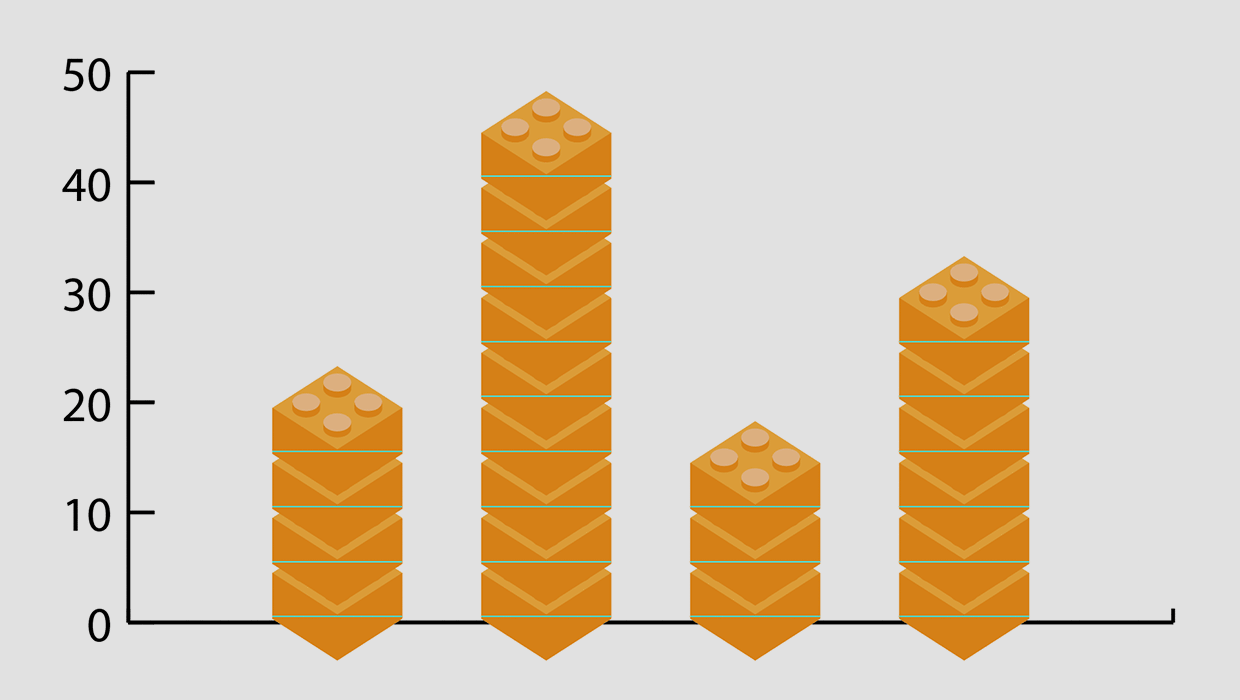
Figure 9: Now the brick looks correct with its overshoot.
This method also works for stacked designs. You have to adjust the invisible rectangle slightly, create yet another graph design and then apply it as a Repeating design to the graph columns.
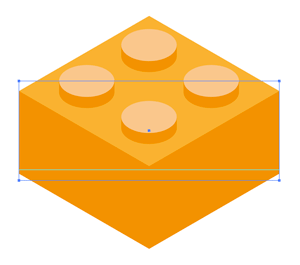

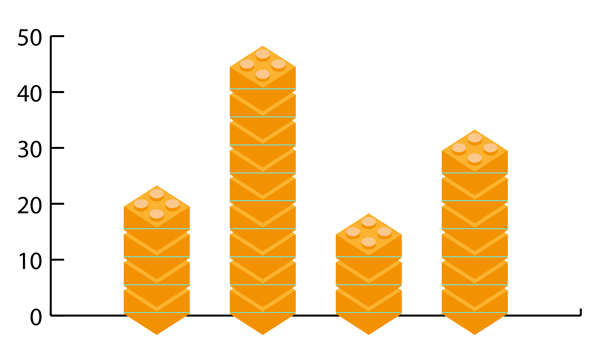
Figure 10: The invisible box adapted for a stacked column design and the design applied to the graph
Labeling Columns
You can put any text in your graph design, but in this case we want Illustrator to use the value as a label for each of the columns, so the text is just a placeholder. To tell Illustrator your text is a placeholder, you input: %00. Style the text and set the alignment to center, so it will always sit nicely on your column, no matter what the numerical value is.


Figure 11: Graph with values included in the design
In order to have decimals in your numbers, change the placeholder text to %02 (for 2 decimal places). Note to international readers: When the graph contains decimals, you might not get the decimals compatible with your notation.
When all you want is a column with text and nothing fancy, you still need the invisible rectangle in the back of your graph design controlling the height. Otherwise, you’ll get a wrong result, because Illustrator maps the total height of the design (including the text) to the height of the original column.

Figure 12: Both columns have a value of 12, but the blue column design doesn’t have an invisible rectangle.
How to Deal with Legends
Sadly, graph legends will always be messed up. The only thing you can do is rotate them 90 degrees, which doesn’t help most of the time. So it’s usually best to hide the legend in the graph Type options (which you can access by choosing Object > Graph > Type or via the contextual menu), and then create your own legend manually.
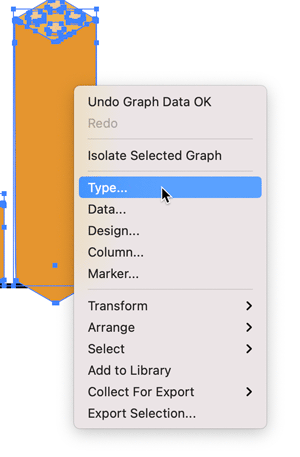
Right-click on a selected graph for convenient access to edit its data and/or appearance.
The Final Word
One last word of caution: Illustrator’s graph function is really old and it can be very flaky. The biggest issue is that whenever you edit the data after applying your custom design, there’s a risk that Illustrator will reset at least some of your customizations. Unfortunately, there’s not a lot you can do about it. You’ll just have to reapply them. Still, it’s worth knowing how to apply custom designs to spruce up your graphs. It really doesn’t take much to vastly improve on the default look.
Commenting is easier and faster when you're logged in!

Recommended for you

Copy Vectors from Illustrator to InDesign (or vice versa)
Why copy-and-paste of vector outlines between Illustrator and InDesign sometimes...
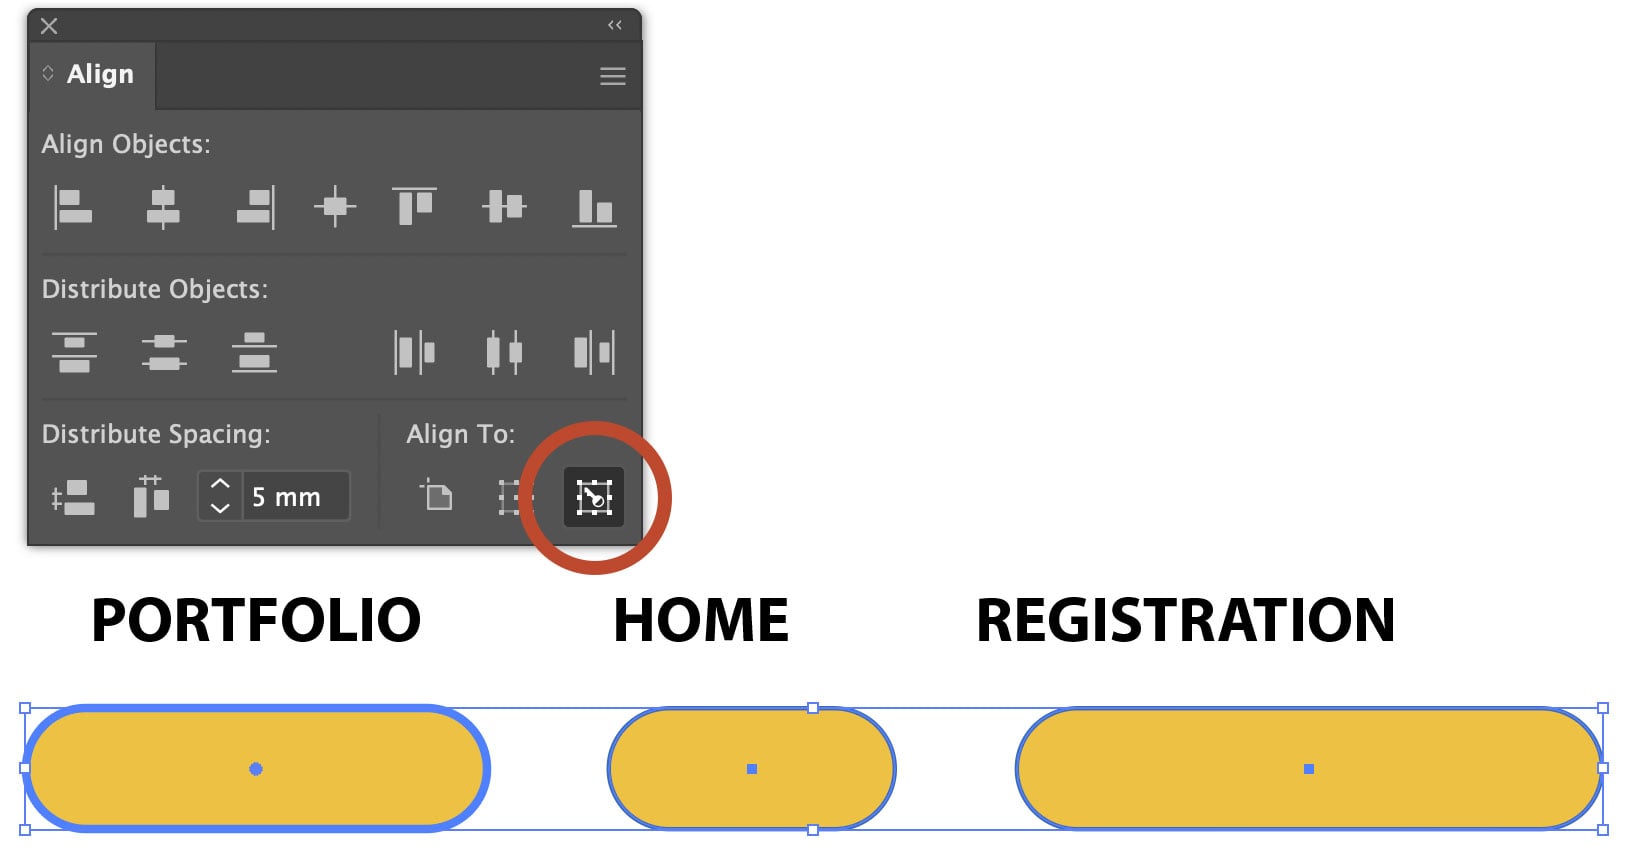
Using Align to Key Object in Illustrator
The Align panel in Adobe Illustrator is a quick and easy way to align or distrib...
From Paper to PDF: Vectorizing Hand-Drawn Artwork with Photoshop and Illustrator
I have a close friend, Mike Manoogian, who is a brilliant lettering and logo des...