

In this week’s CreativePro video, Jason Hoppe shows off a couple of ways to add a bit of pop to Illustrator’s charts and graphs. He demos creating a bar graph with stair-step angles and shading, then shows how to add some depth to a pie chart. This clip comes from Jason’s “Charts and Graphs” session at CreativePro Week 2019.
New videos every Tuesday on our CreativePro YouTube channel. Be sure to subscribe so you don’t miss any!
This article was last modified on August 29, 2025
This article was first published on April 15, 2020
Commenting is easier and faster when you're logged in!

Recommended for you
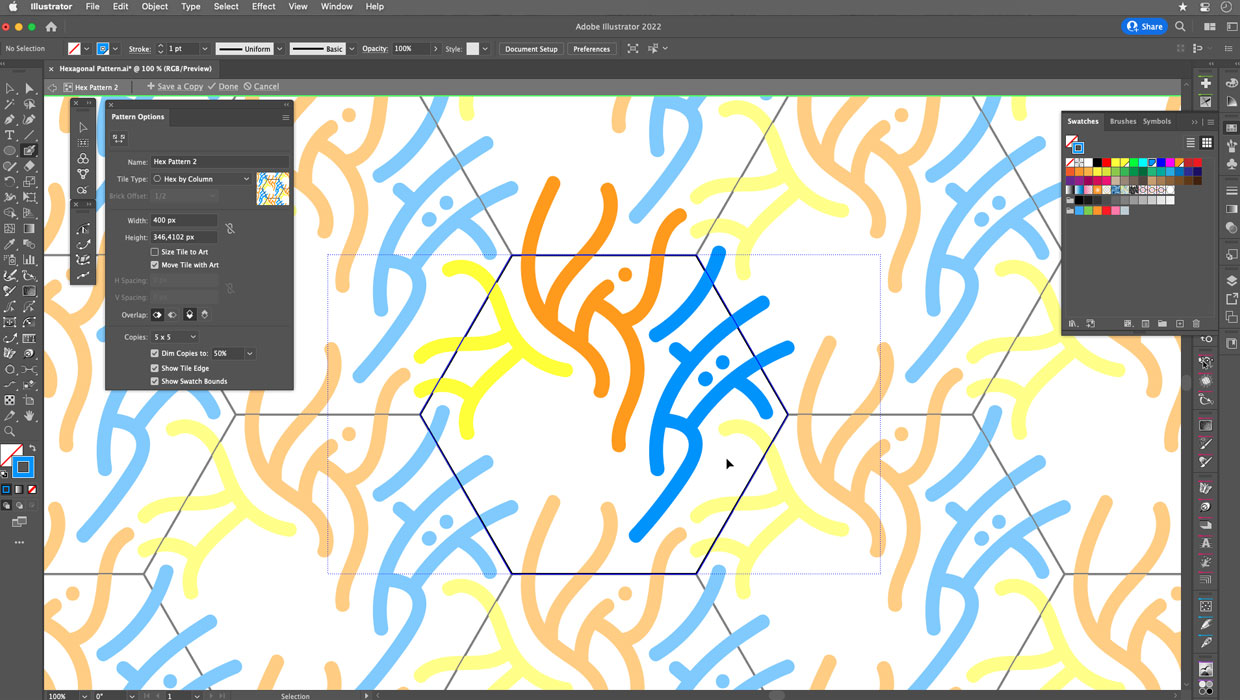
Creating Hexagonal Patterns and Pattern Brushes in Illustrator
Use these advanced techniques to put hexagonal patterns and pattern brushes to w...

Managing Artboards in Illustrator
Useful tips for working with artboards in Illustrator, including locking, arrang...

Review: Datylon Graph for Adobe Illustrator
The most advanced graphing tool available inside Illustrator CC What tools do yo...