

In my last piece, I demonstrated a technique to turn whole numbers into a bar graph using a combination of GREP styles, a fixed width font, and a character style for the line itself.
Not long after this article went live, fellow GREP enthusiast and moderator of the Facebook Group “Treasures of GREP” Jean-Claude Tremblay presented me with an improved version that I would like to share. His improvements were:
1: One master paragraph style.
If a user wanted more than one colored GREPgraph, it required having duplicate sets of character styles for each colored GREPgraph that was used. Jean-Claude’s technique uses one paragraph style instead, allowing other GREPgraphs to be based on the master style, with the exception of a different colored paragraph rule.

This paragraph style “Green Bar” is referencing a master style called “Source Style – Red Bar”. The latter paragraph style contains all GREP styles that use all character styles in the character styles panel
2: Larger number range.
The original technique had a limitation along the same lines as the Chartwell bars font, in that it could only represent whole numbers between 1-1000. Jean-Claude’s technique can represent whole numbers 0-1999: double the amount of the previous techniques.

This technique can represent nearly double the amount of the previous technique and can easily add other colored bar graphs by basing a paragraph style around a source style.
3: Less GREP styles to reference.
This new technique uses 29 GREP styles as opposed to the 55 GREP styles in the original technique – nearly half the amount of GREP styles required.
4: Easier to explain.
Not only does Jean-Claude’s technique uses less styles, the simplicity of the GREP styles make it far easier to explain.
Firstly, 28 character styles need to be created, but can be named with the width value they represent e.g. a character style named 4 = 4% width in the character style only, whereas 300 = 300% width in the character style only. These have to be created for the numbers 1-9, 10-90 (ending with zeros only), 100-900 (last two digits are zeros only) and 1000. One last character style is required for any zero, and has a character width of 1 and a size of 0.1 of a point.
This is because characters can’t be given widths of zero, so a character that is so small it almost can’t be seen has to be used instead.
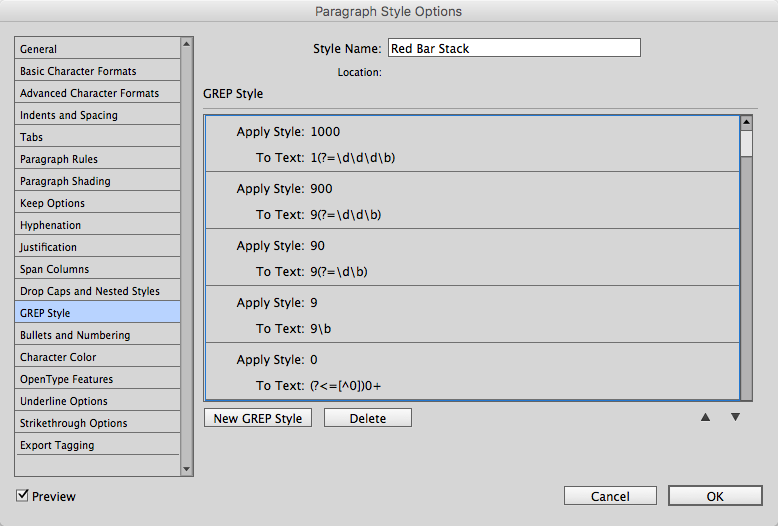
Samples of the main GREP styles to be created.
Next, a base paragraph style is created that contains the following GREP styles.
The number 1000 uses an easy GREP to remember.
Apply the style of 1000 to
1(?=\d\d\d)
To format triple digit numbers, 9 GREPs are required:
Apply the style of X00 to
X(?=\d\d)
(where X is a number 1-9)
To format double-digit numbers, 9 more GREPs are used:
Apply the style of X0 to
X(?=\d)
(where X is a number 1-9)
To format single-digit numbers, 9 more GREPs are used:
Apply the style of X to
X
(where X is a number 1-9)
The last number to format is any zero that appears.
Apply the style of 0 to
(?<=[^0])0+
5: The order of the GREP styles is unimportant.
In the GREP styles panel in the paragraph style dialog box, the order in which the GREP styles appear is usually important as one style can overrule another. In this instance, the order is unimportant.
6: The technique can be used repeatedly in the same text frame
By adding a few more GREP styles to the paragraph style and a few character styles, the technique can be expanded to create stacked bar graphs.

The top line demonstrates the technique, while the text underneath is exactly the same text as above, but in a different paragraph style.
To create this stacked bar graph, character styles were created for each colored bar graph, and a character style for the Separator line. These character styles are then applied to the text using the following GREP styles:

So from humble beginnings of an experiment to see if the technique was even possible, the “GREPgraphs” technique has definitely been streamlined and improved. It has also added a functionality to InDesign’s Data Merge feature that was not in the software itself – the ability to not only create live bar graphs during a Data merge, but to place graphics on X-Y coordinates or create live infographics.
Anyone interested in other amazing abilities of GREP should make sure to check out Jean-Claude’s Facebook group “Treasures of GREP” and check out or GREP resources here.
This article was last modified on July 25, 2019
This article was first published on December 8, 2016
Commenting is easier and faster when you're logged in!

Recommended for you

Search for Foreign Language Characters in Text
InDesign offers very fine grained control over find/change, including which sort...

Kerning Drop Caps
How to automate the kerning of tricky letter combinations in drop caps with InDe...
Find All Headings Based on a Pattern
Here's a short and easy GREP pattern you can use to find one-line paragraphs