
How to Create Timelines with Parallax Effects in PowerPoint
Level up your timeline graphics in just three easy steps.


This article appears in Issue 39 of CreativePro Magazine.
This year during CreativePro Week, I gave a “Three Minutes Max” presentation about using the parallax effect to level-up timeline graphics in Microsoft PowerPoint. You can watch a video of it here. The attendees were so excited with the effect—and how easy it was to design—that I had to share the technique with a wider audience. Here’s the basic method: By slightly moving the background image, moving the foreground timeline graphic more from slide to slide, and applying the Morph transition effect, you can create the illusion of depth (Figure 1). This creates a parallax effect with the timeline and a new way to engage your audience. The effect also provides context so that your audience always knows where you are in your story.

Figure 1. For the parallax effect, move the background image relative to your foreground timeline graphic and apply a Morph transition to Slides 2–4 to create the illusion of depth.
Even better, it all happens in three simple steps. I’ll lay out the steps in this article, and you can download a sample PowerPoint file for reference (and practice). Save both for the next time you want to wow your audience with an upgraded version of an old standard.
The effect looks complex, but it’s fun, purposeful, and easy. Let’s give it a try.
1. Insert a Picture Wider than Your Slide
Find a picture that complements your timeline elements, and place it in the background. If you’re showing a timeline related to company growth, you might use a photograph of your corporate offices or a warehouse. If you’re teaching about the evolution of our solar system, find an image of outer space. Whatever your topic, choose a photograph that compliments your subject matter. Although the image will be behind your primary timeline graphic and will not be the focus, you want it to reinforce your messaging and brand, when applicable. I almost always use Pexels, Pixabay, Unsplash, and iStock for royalty-free photographs. If I want something unique and specific, I use Adobe Firefly or Midjourney to create a custom AI-generated background image. Also, consider reviewing your organization’s website or image repository for additional ideas.
Scale your background image so that a portion is off the slide to the right. Always select, create, or crop an image so that it is wider than your slide. For reference, take a look at Figure 2: The white rectangle is the slide boundary and the portion of the image that will be displayed during your presentation. The right portion of the background cityscape photo will be off the slide and hidden when you present in Slide Show mode.
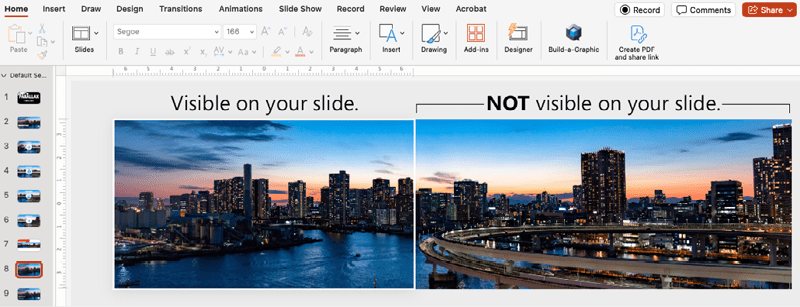
Figure 2. The first slide after inserting a wide cityscape photograph from Pexels as the background
Step 2: Insert a Timeline Graphic
You can either make or insert a timeline graphic. I used the Build-a-Graphic app to insert my timeline. You can also manually insert text, circles, lines, arrows, and icons into your slide to build your graphic. Either way, place your timeline graphic on top of the background image (Figure 3). Be sure to review and finalize your graphic to avoid time-consuming updates.

Figure 3. A timeline from Build-a-Graphic placed over the background image
Next, group and scale the graphic to the size at which you want it to appear on each slide, and move the timeline off the slide to the right. Figure 4 shows what you see in Slide Show mode. Notice that Phases 1.2 through 1.4 are not visible.
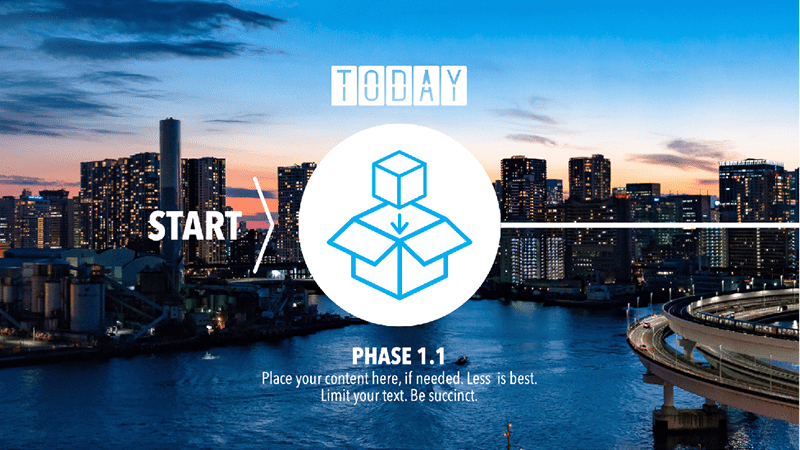
Figure 4. Scale up the timeline graphic, and slide it right so only Phase 1.1 is visible on the first slide. The other phases will be revealed on subsequent slides.
For improved accessibility, make sure your background image does not aesthetically compete with your timeline graphic. You don’t want too much visual noise, excessive detail, or low contrast. If you find the background lowers the timeline’s legibility, you can darken, lighten, or blur your image. Alternatively, try placing a transparent box over the background to lower the contrast against your timeline. In our example, the white text was initially hard to read, but scaling up the timeline improved legibility to within acceptable parameters for most situations. When in doubt, use PowerPoint’s Check Accessibility feature (found in the Review tab) to confirm compliance with the latest standards.
Step 3: Duplicate, Move, and Morph
With the background and timeline in place, we’re ready to generate the parallax effect. First, duplicate the slide containing your elements. The number of duplicate slides should coincide to the number milestones in your timeline graphic. Our example timeline has four milestones: Today (Phase 1.1), 1 Month (Phase 1.2), 2 Months (Phase 1.3), and 3 Months (Phase 1.4). I recommend keeping your timeline to fewer than 10 points, so the effect doesn’t overwhelm your presentation and message.
Next, create movement between the slides using the Morph transition. For reference, Figure 5 shows the placement of the background photo versus the foreground timeline graphic on each of the four duplicated slides. On Slide 1, make sure the background starts to the far right, so the photograph’s left edge is aligned with the left side of the slide (Figure 5, Slide 1). Center your first timeline milestone (Phase 1.1) on the Slide 1.
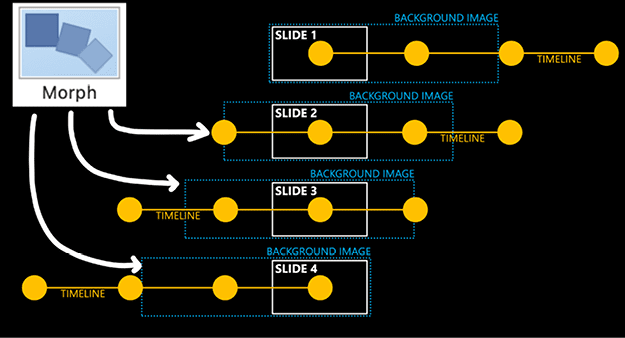
Figure 5. A guide to the relative positioning of the background and timeline as well as where to apply Morph transitions (slides 2–4 in this case)
For Slide 2, nudge the background image to the left, while moving the second timeline milestone (Phase 1.2) to the center. The first milestone (Phase 1.1) is now off the slide to the left. Next, apply the Morph transition to this slide (select Transitions > Morph). When displayed in Presenter view, this transition makes it appear like the background and timeline elements are sliding into the frame at different rates giving the illusion of three-dimensional space, known as the parallax effect.
Follow this technique for the third and fourth slides. Nudge the background image to the left. Move the next timeline milestone to the center of each subsequent slide, and apply the Morph transition to the remaining slides.
End with the background image’s right edge aligned with the slide’s right side (Figure 5, Slide 4). In most cases, when planning your layouts across your duplicate slides, you will want to move the background enough to end with the right side of your image taking up the full slide. For smaller background images and more milestones, nudge the background less between slides to end with the right side of the image. Use Figure 5 as a reference when situating your image and timeline on each slide.
Bonus Step: Highlight a Timeline Element
You can apply Morph as an animation to a timeline element to highlight a talking point. In Figure 6, for example, I placed a Build-a-Graphic isometric graphic in the circle in place of one of the milestone icons (3 Months, Phase 1.4) to better illustrate this effect.

Figure 6. Graphic placed inside timeline circle at the 3 Months point
Duplicate your slide, and make your desired changes. For the example, I scaled the circle, scaled the isometric graphic, and added additional talking points. Next, apply Morph to the duplicated slide. Figure 7 shows the enlarged circle and graphic with additional talking points, while Figure 8, shows what the audience will see when it is presented in Slide Show mode. You can reverse this effect by returning to the original image and reminding the audience where you are in the timeline. This provides context, so your audience always knows where they are in your story.
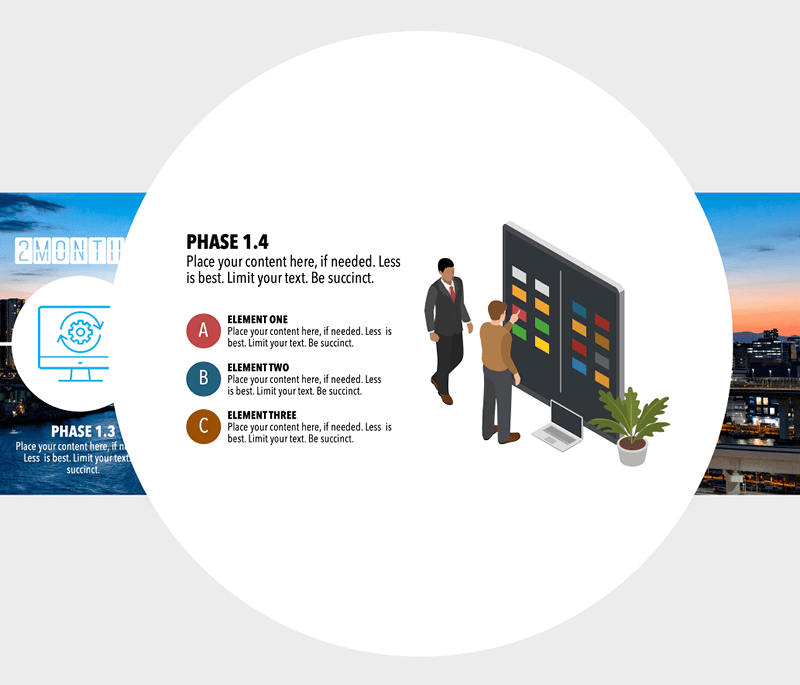
Figure 7. The modified Phase 1.4 slide in Normal view with the enlarged circle, enlarged graphic, and new additional talking points (text boxes with my narrative)

Figure 8. Phase 1.4 in Slide Show mode as it will appear to the audience
Moving Along
Using new and unique ways to show content and data keeps your audience engaged and helps them remember more. A timeline graphic can communicate goals, past and future states, how long a process takes, and much more. If you continually use a standard timeline the same way every time, however, your audience may become bored and disengaged. When used properly, a parallax timeline improves understanding, recollection, and adoption by providing context in a unique way.
Commenting is easier and faster when you're logged in!

Recommended for you
How to Create Outlined Text Effects in PowerPoint
Create cool text effects for your presentations right in PowerPoint with Stephy...

TypeTalk: Dos and Don’ts for Effective Web Content and Typographic Treatment
Viewing and reading habits differ on the Web from those in print. Therefore, you...

Super Simple Swatch Creation from Hailpixel
For a new and easy way to experiment with color and generate swatches, check out...