
Interview with Valentina D’Efilippo, Creative Director and Data Designer
Thaddeus Coates shares his fun and fearless approach to design and how community inspires his vibrant optimism and character designs.
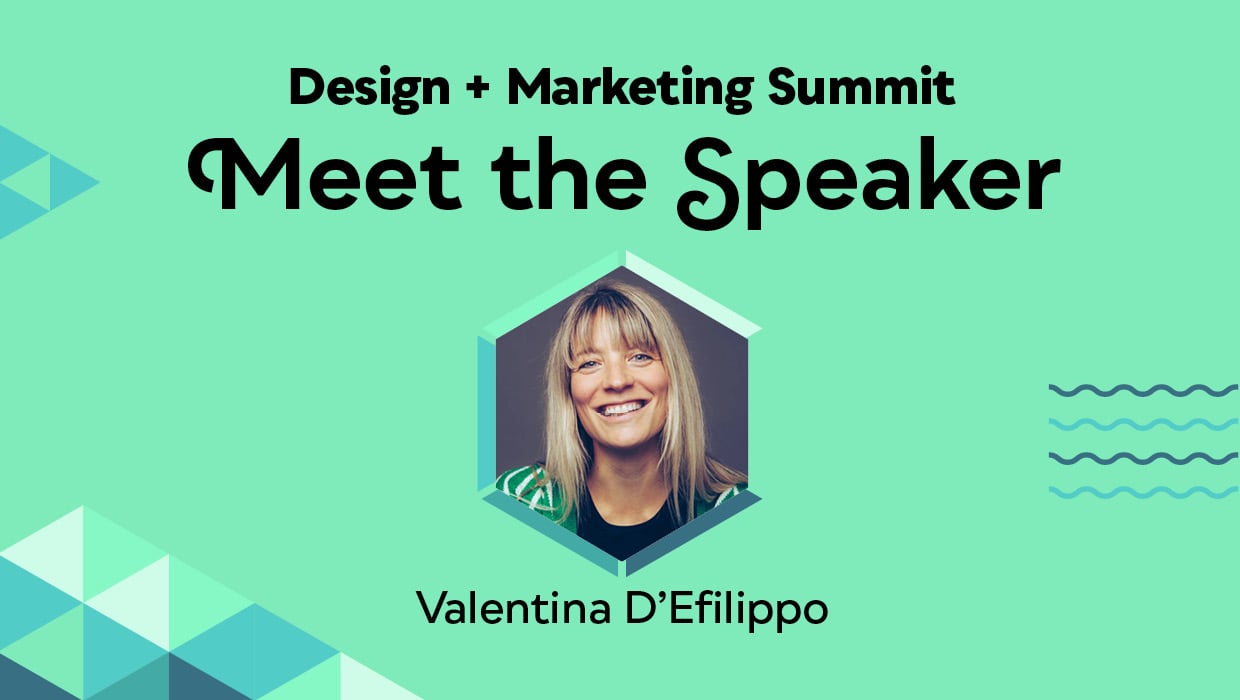

Valentina D’Efilippo is is an award-winning designer, creative director, and author renowned for her ability to inspire, move, and connect people through data-driven experiences.
She is speaking at the Design + Marketing Summit 2026, which takes place online September 14–15, 2026. We thought it would be fun to get to know her better with some Q&A.
This is your first time presenting for CreativePro, and many people in our community may be new to your work. How do you describe what you do?
I’m a creative director, data designer and author. I help people make sense of complex information and turn it into something clear, engaging and memorable.That might involve designing an infographic, an animation, an interactive experience or a visual system.
I also teach designers and organisations how to communicate with data more effectively. At the heart of my work is a simple question: how can design help people not only understand information, but also connect with what it means?
You’re presenting Your Data Has a Story to Tell. What do you hope people feel more confident doing after your session?
I hope people leave feeling less intimidated by data and more confident making creative decisions with it.
I want them to feel able to look beyond the obvious chart, identify the story that matters and choose a visual approach that supports that story. I hope to inspire people to become more curious, ask better questions and think carefully about what their audience needs to understand or feel.
A lot of designers hear “data” and immediately think spreadsheets, charts, or dashboards. What do you see when you look at data?
I see evidence of human lives, behaviours and systems.
A spreadsheet might look dry at first, but every number has come from somewhere. It might represent a person, a journey, a decision, an inequality or a change over time. Data is not the story by itself, but it contains clues that can help us uncover one.
I also see data as creative material. Just as a writer works with words or a filmmaker works with images, a data designer works with quantities, patterns, relationships and context.
For someone who wants to get better at visualising information, where should they begin?
Begin with the question, not the software.
Ask yourself what the data is really about, what you want the audience to understand and why it matters. Then look closely at the data. What is changing? What is surprising? What is missing? What comparisons are meaningful?
I also encourage people to sketch before opening a design tool. Sketching helps you explore different ideas quickly without becoming attached to the first solution. You can always refine the visual later. The important thing at the beginning is learning to see the story and deciding what deserves attention.
You’ve described data design as a way to inspire empathy and action. Can you share an example from your own work?
One example is Palestinian Poppy, a hand-painted visualisation I created to represent Palestinian children, women and medical/press workers killed in Gaza between October 2023 and October 2025.
The work is made from thousands of individual marks, with each one representing a person.
I wanted to explore the emotional weight of counting. Large numbers can become difficult to comprehend, especially when we encounter them repeatedly in the news. By giving each life a physical mark, the act of making the piece became slow and deliberate. The aim was not to simplify the situation, but to create a space where people could pause and recognise the human reality behind the statistic.
For me, that is where data design can become powerful. It can help us understand the scale of something while still remembering the individuals within it.
This article was last modified on June 25, 2026
This article was first published on June 25, 2026
Commenting is easier and faster when you're logged in!
Recommended for you

Recipes for Applying—and Ignoring—Text Wrap in InDesign
Learn when to apply and when to ignore Text Wrap in InDesign.

App Recalls What Using a Typewriter Was Really Like
A while back, I wrote about an iPad app that simulated the awesomeness that was...
Creating a Magnetic Ornamental Typeface
During a particularly heated discussion that flared up because someone not in th...