Creating Instant Charts With Chartwell
You can create charts and graphs on the fly from live text with the ingenious font Chartwell.

One of the coolest things I saw at the InDesignSecrets Print and ePublishing Conference back in May was during the final tips and tricks session, when Michael Ninness wowed the crowd by showing us a font that automatically converts numbers into charts and graphs. The font is called Chartwell, and it was developed by Travis Kochel. Travis recently sent us a free copy so we could review it here. Thank you, Travis!
Chartwell uses a head-smackingly clever method of employing ligatures to swap number glyphs with ones that resemble components of bar, line, and pie charts.
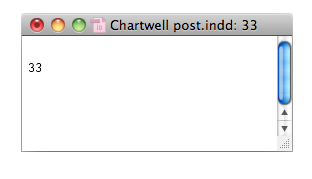
For example, to create a pie chart wedge that approximately represents one third of a circle, first type “33”.
With the text selected, confirm that it’s set to use ligatures.
Then change the font to Chartwell Pies.
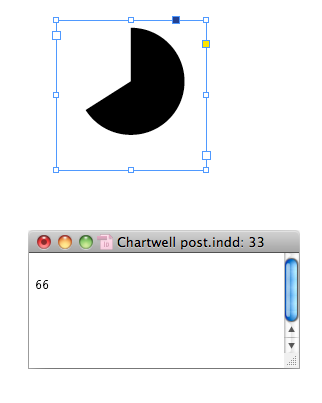
The number glyphs are instantly swapped out for a pie piece that accurately represents 33% of the pie.
If you look in the Story Editor, you can see your “33” and edit it.
Change it to “66” to make a wedge approximately two-thirds of the whole pie.
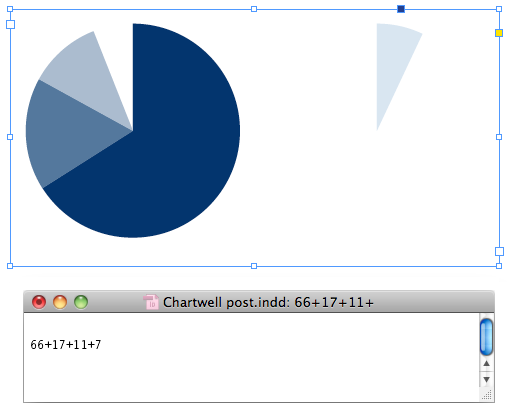
If you want a pie with multiple wedges, you enter a string of whole numbers separated by + signs. The pie pieces are arranged clockwise around the circle. You can apply a different color to each number to distinguish the wedges.
If the values add up to more than 100, the piece that won’t fit becomes the start of a new graph.
Chartwell also contains regular letter and number glyphs, so you can quickly switch back and forth between numbers and charts without switching fonts, just by turning ligatures off and on.
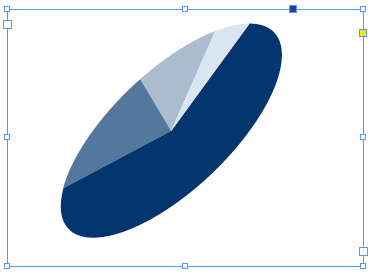
After you’ve created a chart, you can modify the look of it. You can select a whole chart and apply scaling or skewing if you like.
And there’s nothing stopping you from creating paragraph styles that use Nested Styles or GREP styles, for automated formatting.
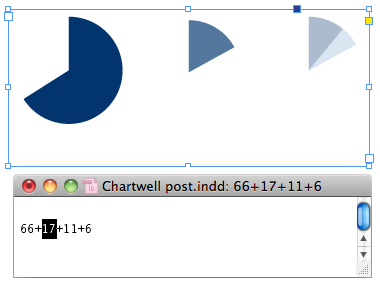
But if you try to do anything tricky like mixing font sizes or formatting other than color within a chart, it breaks into pieces. Like here I changed the font size applied to the number “17.”
You can of course also convert Chartwell charts to outlines and then transform them to your heart’s content. Here, I made an extruded version of the pie chart by converting a copy to outlines and reshaping the pieces into the sides of a cylinder with the Pen tool.
You can also create ring-shaped charts by adding a letter at the end of the string of numbers.
The size of the circle in the center is determined by the letter, ranging from lowercase a to uppercase Z.
The font also comes in versions for line charts:
And bar charts.
Each Chartwell font is $20, or you can purchase the whole set for $50. Each one also comes with webfonts and a javascript plug-in that makes the glyph substitutions for online use. You can read the details of how to use Chartwell Web here. [2013 Update: More chart styles have been added, the price has gone up a little bit, and it is now sold by Vectro Type; more information here.]
About the only negative I’ve found is the limitation of working only with whole numbers. It means that you can’t have something like a pie chart perfectly divided into thirds. The closest you can get is to have wedges of 33%, 33%, and 34%. But this is a pretty small tradeoff in most cases for the awesomeness of automatic charts, courtesy of Chartwell.
This article was last modified on October 18, 2023
This article was first published on July 27, 2011


